| Site Name | Area | Strata | 1997 | 1994 | 1985 | 1974 | 1964 | 1959 |
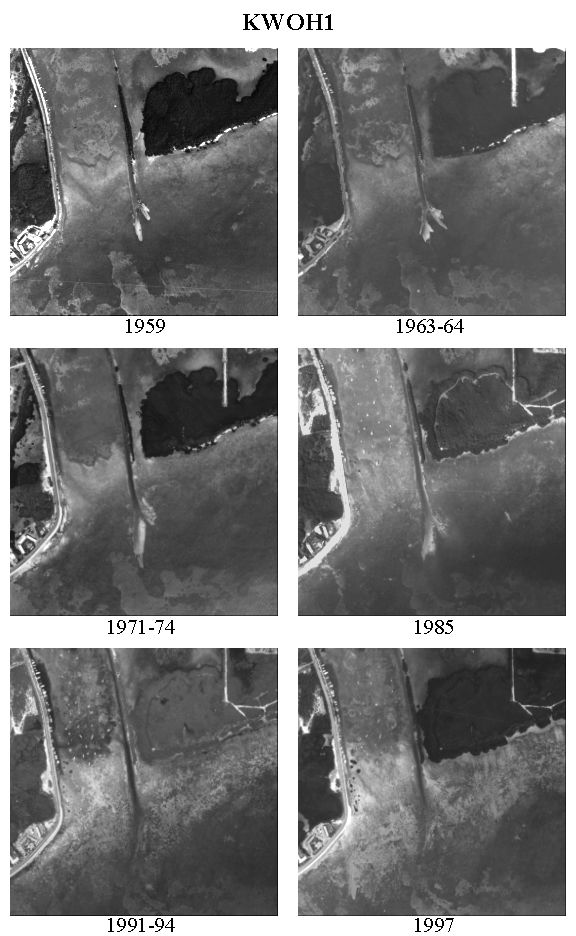
| Houseboat Row | KW | OH1 | PD-4488-A1-04 | PD-4221-01-06 | PD-3117-01-05 | PD-913-01-05 | PD-230-01-05 | PD-88-02-10 |
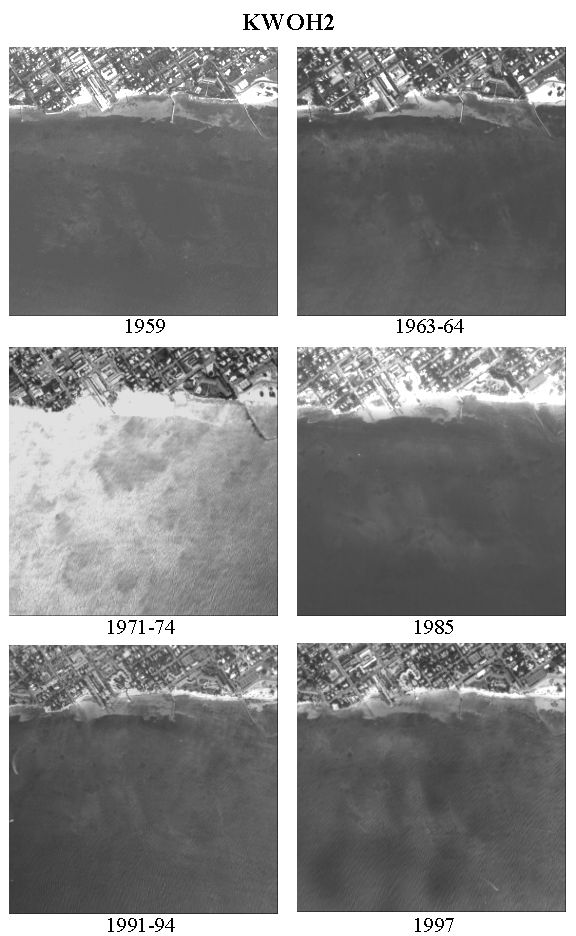
| Southermost Point | KW | OH2 | PD-4488-A1-02 | PD-4221-01-04 | PD-3117-01-02 | PD-913-01-02 | PD-230-01-03 | PD-88-01-05 |
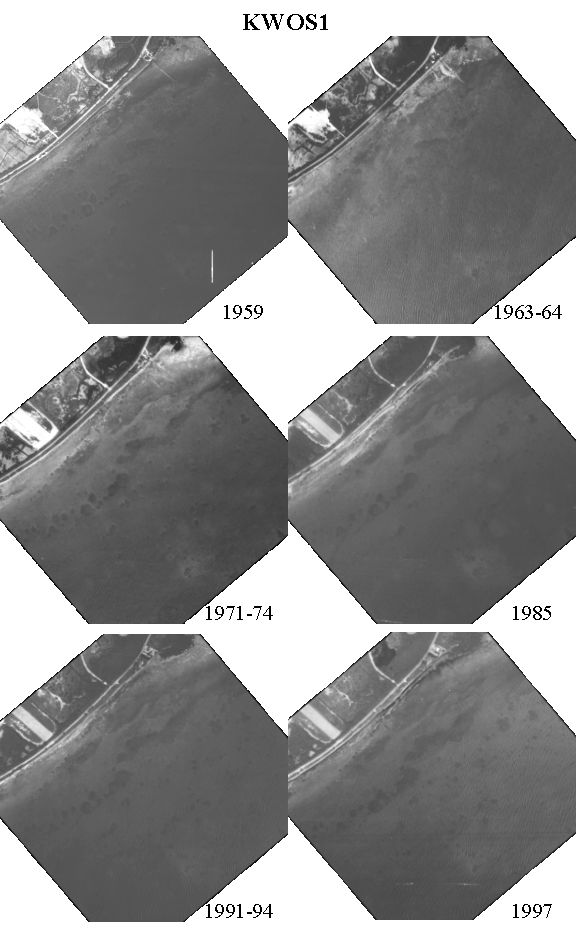
| Rock Point | KW | OS1 | PD-4488-02-08 | PD-4221-02-09 | PD-3117-02-08 | PD-913-01-08 | PD-230-01-09 | PD-88-02-19 |
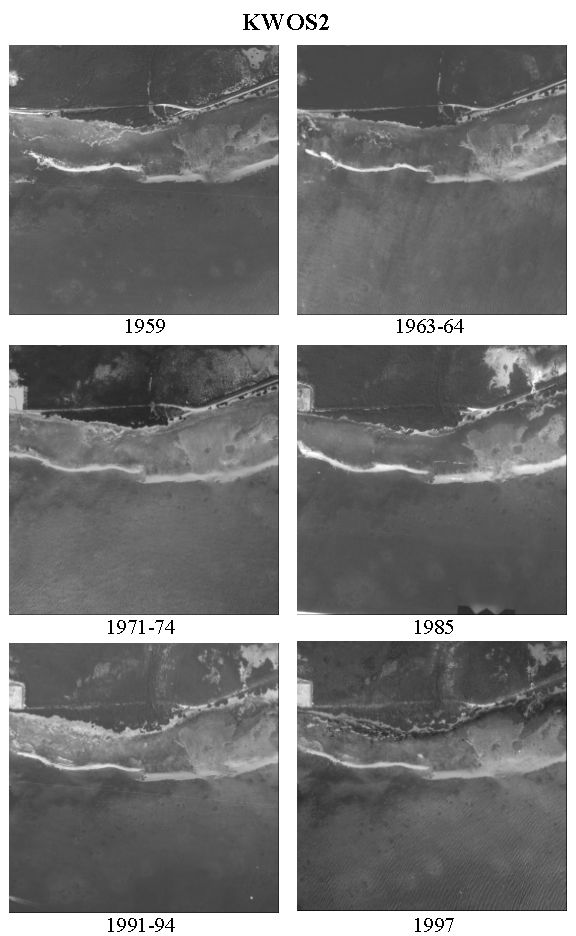
| West Chica | KW | OS2 | PD-4488-01-06 | PD-4221-01-09 | PD-3117-01-05 | PD-913-01-06 | PD-230-01-07 | PD-88-02-14 |
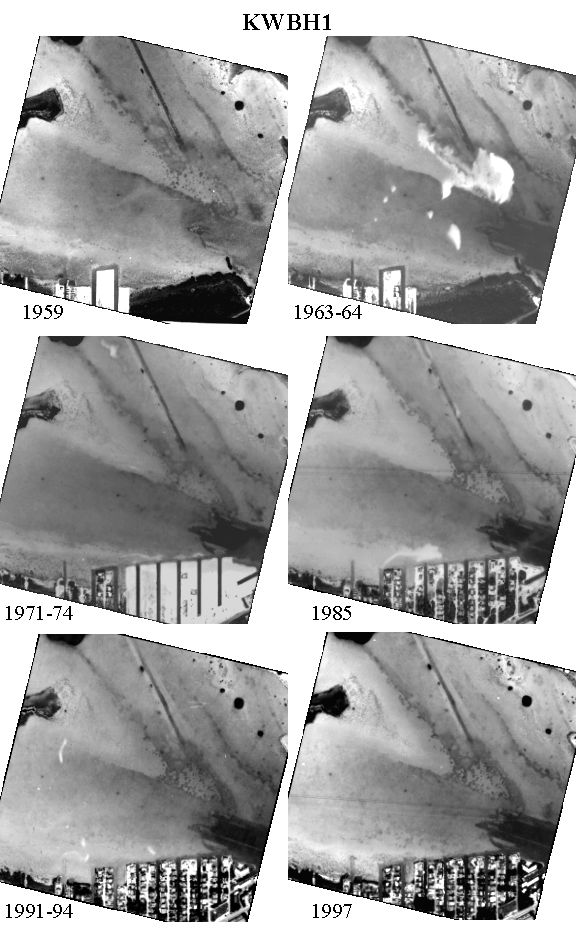
| Big Coppitt | KW | BH1 | PD-4488-03-08 | PD-4221-03-07 | PD-3117-03-05 | PD-913-02-11 | PD-230-02-10 | PD-88-04-09 |
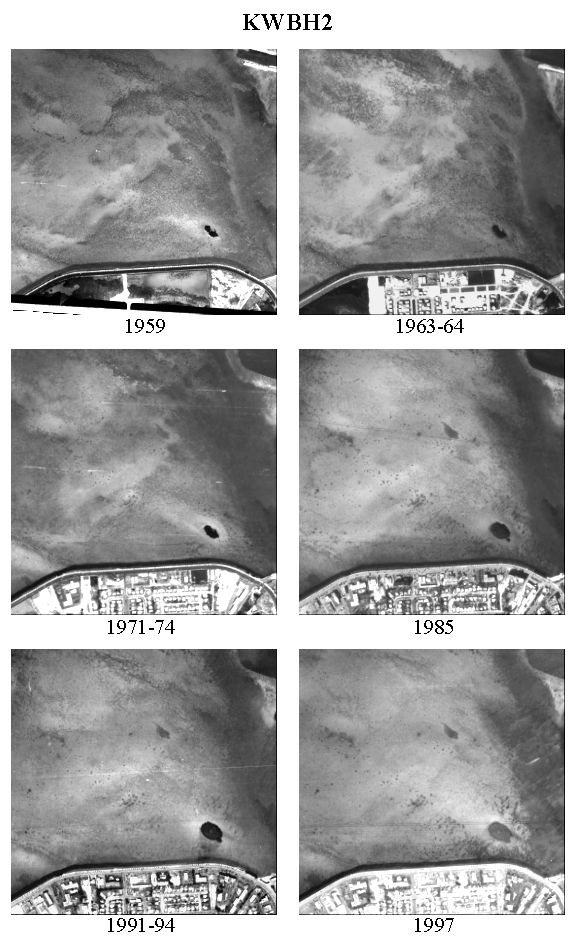
| Sigsbee Park | KW | BH2 | PD-4488-02-04 | PD-4221-02-04 | PD-3117-02-04 | PD-913-01-03 | PD-230-02-05 | PD-88-03-07 |
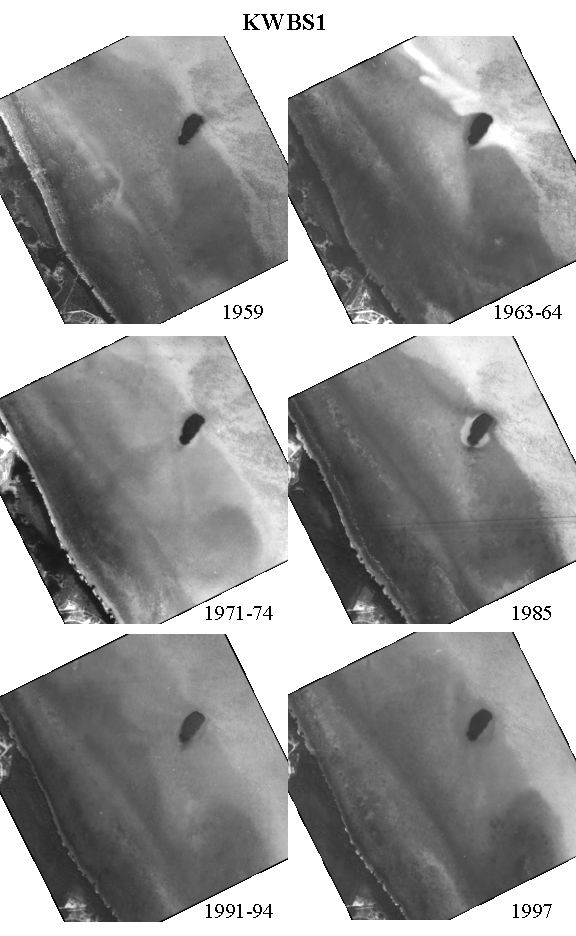
| Anonimo Key | KW | BS1 | PD-4488-03-07 | PD-4221-03-06 | PD-3117-03-02 | PD-913-02-09 | PD-230-02-09 | PD-88-03-14 |
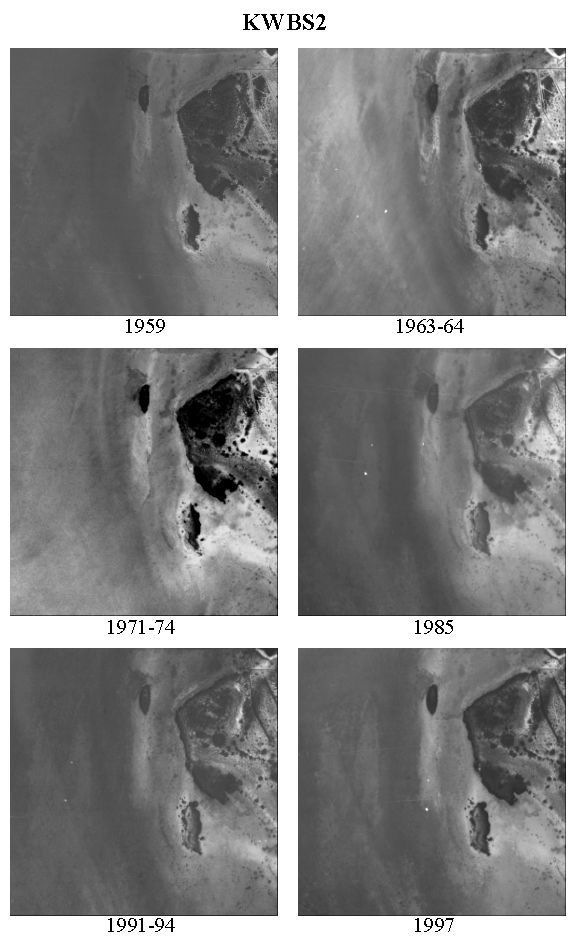
| Chica Channel | KW | BS2 | PD-4488-A2-06 | PD-4221-02-06 | PD-3117-02-06 | PD-913-02-07 | PD-230-02-08 | PD-88-03-12 |
(click on thumbnails for enlarged photos)
| BH1 | BH2 | BS1 | BS2 | OH1 | OH2 | OS1 | OS2 | |||||||||
| Net Change | Variability | Net Change | Variability | Net Change | Variability | Net Change | Variability | Net Change | Variability | Net Change | Variability | Net Change | Variability | Net Change | Variability | |
| Mean | -0.20 | 0.12 | -0.17 | 0.15 | -0.27 | 0.18 | 0.07 | 0.13 | -0.30 | 0.28 | -0.17 | 0.08 | 0.03 | 0.01 | -0.17 | 0.15 |
| StDev | 0.41 | 0.21 | 0.59 | 0.20 | 0.52 | 0.26 | 0.52 | 0.21 | 0.65 | 0.27 | 0.38 | 0.19 | 0.18 | 0.07 | 0.46 | 0.29 |
(click on thumbnails to compare results from other study areas)
| 1959 | 1963-64 | 1971-74 | 1985 | 1991-94 | 1997 | |||||||
| Net Change | Variability | Net Change | Variability | Net Change | Variability | Net Change | Variability | Net Change | Variability | Net Change | Variability | |
| BH1 | 0.00 | 0.00 | 0.00 | 0.00 | -4.00 | 0.35 | 0.00 | 0.00 | 0.00 | 0.37 | -2.00 | 0.25 |
| BH2 | 0.00 | 0.00 | 0.00 | 0.00 | -4.00 | 0.35 | 2.00 | 0.37 | 0.00 | 0.00 | -3.00 | 0.31 |
| BS1 | 0.00 | 0.00 | 1.00 | 0.32 | -5.00 | 0.38 | -3.00 | 0.31 | -2.00 | 0.37 | 1.00 | 0.18 |
| BS2 | 0.00 | 0.00 | 0.00 | 0.26 | -1.00 | 0.18 | 1.00 | 0.32 | 1.00 | 0.18 | 1.00 | 0.32 |
| OH1 | 0.00 | 0.00 | 3.00 | 0.31 | -3.00 | 0.31 | -1.00 | 0.41 | -6.00 | 0.55 | -2.00 | 0.37 |
| OH2 | 0.00 | 0.00 | 1.00 | 0.18 | 0.00 | 0.00 | -5.00 | 0.38 | 0.00 | 0.00 | -1.00 | 0.18 |
| OS1 | 0.00 | 0.00 | 0.00 | 0.00 | 0.00 | 0.00 | 1.00 | 0.18 | 0.00 | 0.00 | 0.00 | 0.00 |
| OS2 | 0.00 | 0.00 | -2.00 | 0.25 | 0.00 | 0.00 | -2.00 | 0.52 | 1.00 | 0.41 | -2.00 | 0.25 |
| Mean | 0.00 | 0.00 | 0.38 | 0.17 | -2.13 | 0.19 | -0.88 | 0.31 | -0.75 | 0.24 | -1.00 | 0.23 |
| StDev | 0.00 | 0.00 | 1.32 | 0.13 | 1.96 | 0.16 | 2.20 | 0.15 | 2.17 | 0.20 | 1.41 | 0.11 |
(click on thumbnails to compare results from other study areas)
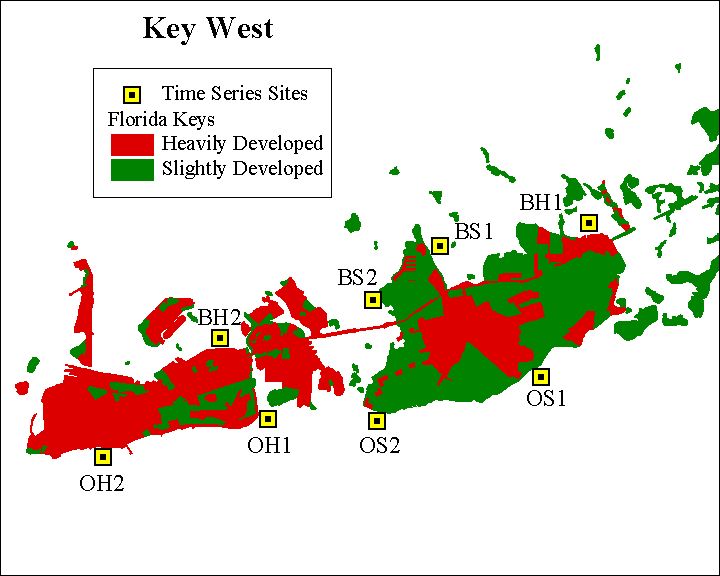
Spatial Variation in Nearshore Benthic Communities: Key West Study Area
Nutrient Regimes of Nearshore Benthic Communities: Key West Study Area
Relationships Between Project Data and Florida Keys Land Use: Key West Study Area