| Site Name | Area | Strata | 1997 | 1994 | 1985 | 1974 | 1964 | 1959 |
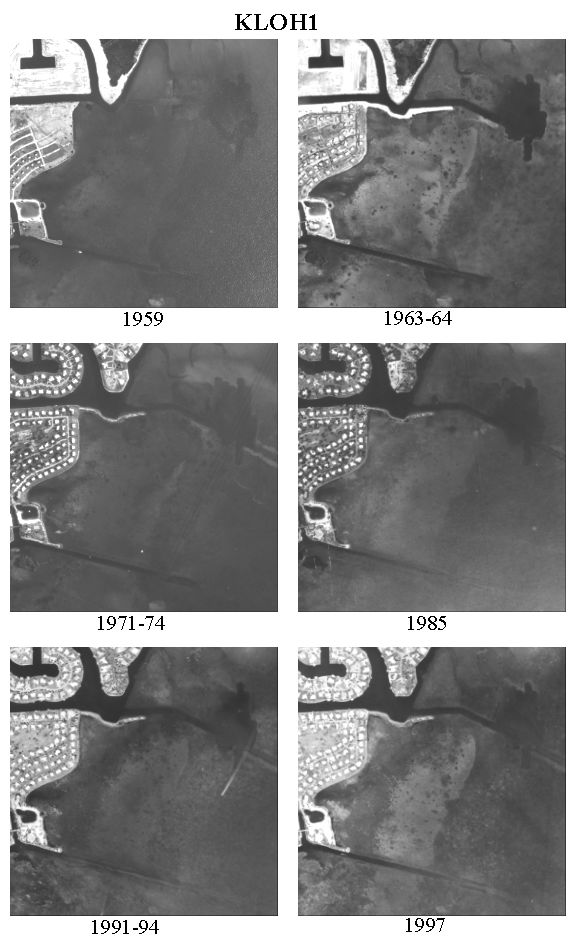
| Ocean Reef | KL | OH1 | PD-4488-28-04 | PD-4221-28-03 | PD-3117-28-02 | PD-1491-04-30 | PD-230-12-19 | PD-88-14-30 |
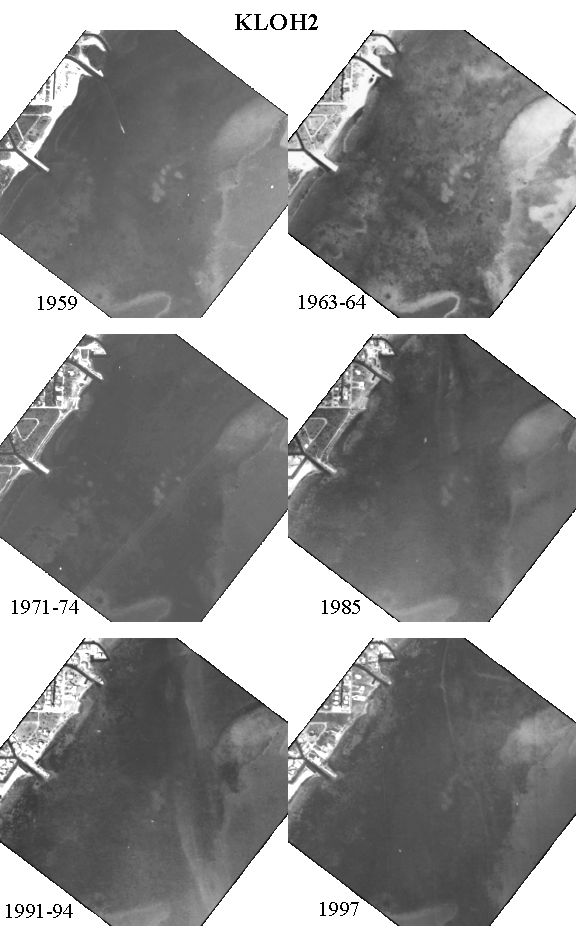
| Port Largo | KL | OH2 | PD-4488-23-04 | PD-4221-23-03 | PD-3117-23-02 | PD-1491-04-14 | PD-230-12-04 | PD-88-13-10 |
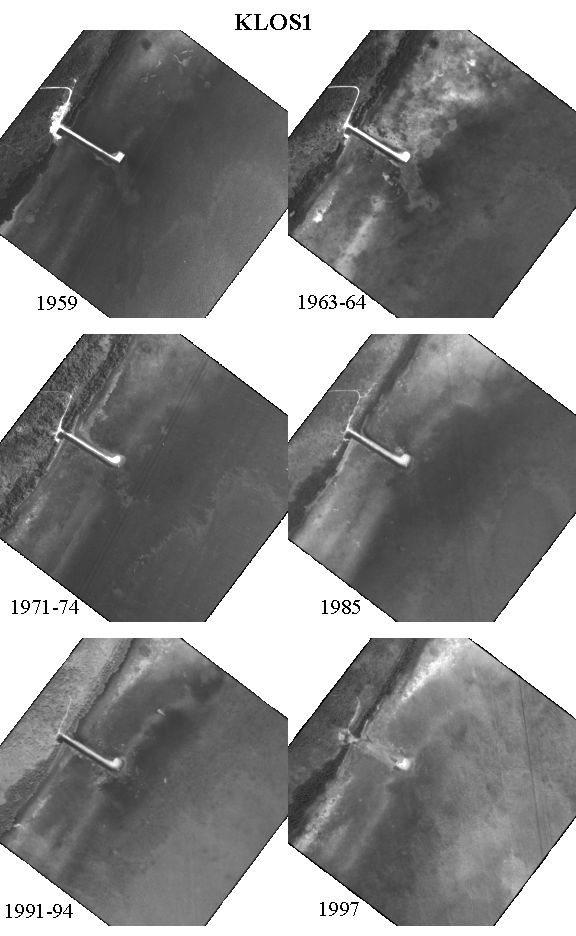
| El Camino | KL | OS1 | PD-4488-27-04 | PD-4221-27-04 | PD-3117-27-02 | PD-1491-04-27 | PD-230-12-16 | PD-88-14-24 |
| El Radabob | KL | OS2 | PD-4488-25-03 | PD-4221-25-02 | PD-3117-25-02 | PD-1491-05-02 | PD-230-12-08 | PD-88-14-08 |
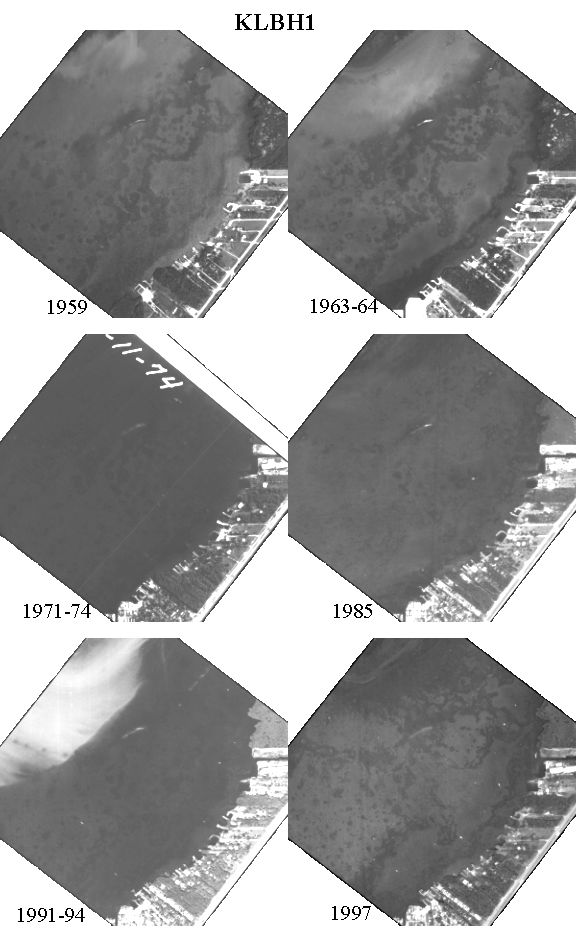
| Tarpon Basin | KL | BH1 | PD-4488-23-06 | PD-4221-23-05 | PD-3117-23-04 | PD-1491-04-15 | PD-230-13-09 | PD-88-16-05 |
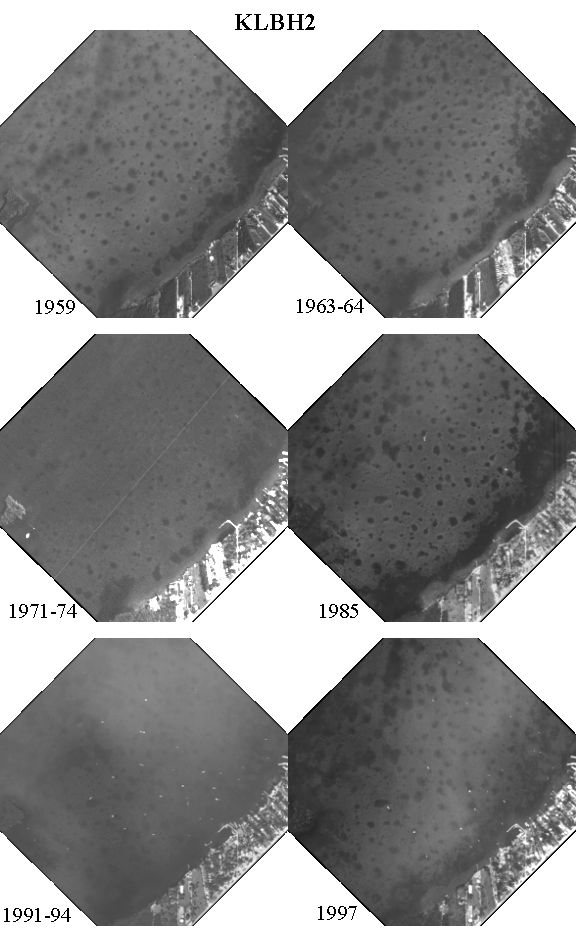
| Sunset Cove | KL | BH2 | PD-4488-22-04 | PD-4221-22-03 | PD-3117-22-05 | PD-1491-04-13 | PD-230-13-07 | PD-88-13-09 |
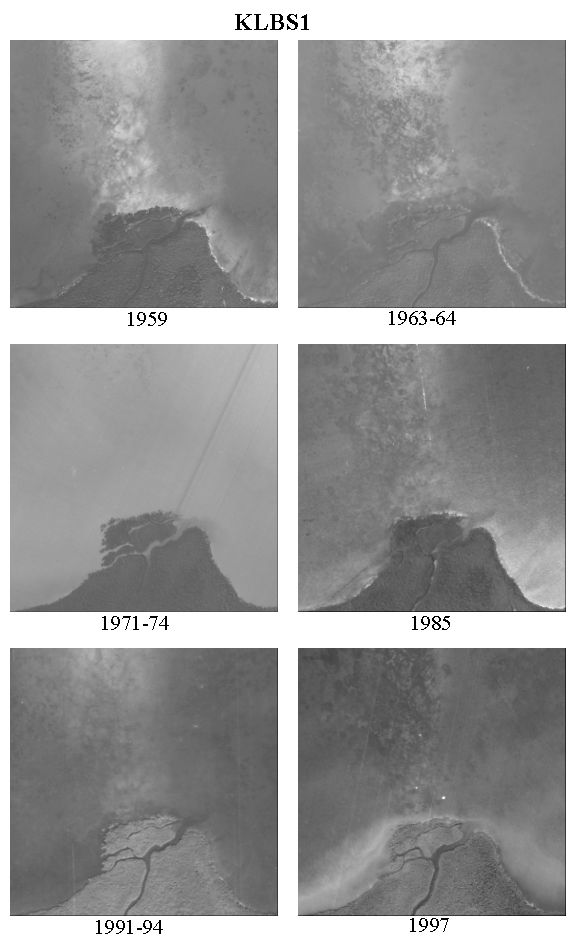
| Card Sound | KL | BS1 | PD-4488-26-08 | PD-3887-26-09 | PD-3117-26-08 | PD-913-10-15 | PD-230-13-18 | PD-88-16-26 |
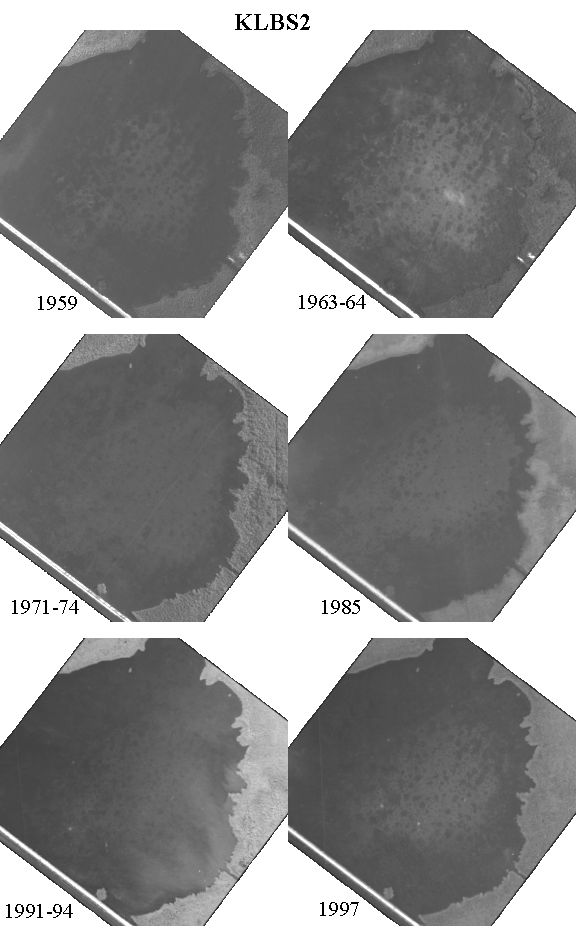
| Lake Surprise | KL | BS2 | PD-4488-25-05 | PD-4221-25-04 | PD-3117-24-07 | PD-1491-04-20 | PD-230-13-12 | PD-88-15-12 |
(click on thumbnails for enlarged photos)
| BH1 | BH2 | BS1 | BS2 | OH1 | OH2 | OS1 | OS2 | |||||||||
| Net Change | Variability | Net Change | Variability | Net Change | Variability | Net Change | Variability | Net Change | Variability | Net Change | Variability | Net Change | Variability | Net Change | Variability | |
| Mean | -0.30 | 0.43 | 0.57 | 0.30 | 0.80 | 0.44 | -0.13 | 0.19 | 0.10 | 0.23 | 0.63 | 0.44 | -0.27 | 0.22 | -0.23 | 0.44 |
| StDev | 0.99 | 0.29 | 0.73 | 0.23 | 0.55 | 0.16 | 0.35 | 0.29 | 0.92 | 0.27 | 0.85 | 0.21 | 0.58 | 0.30 | 0.57 | 0.29 |
(click on thumbnails to compare results from other study areas)
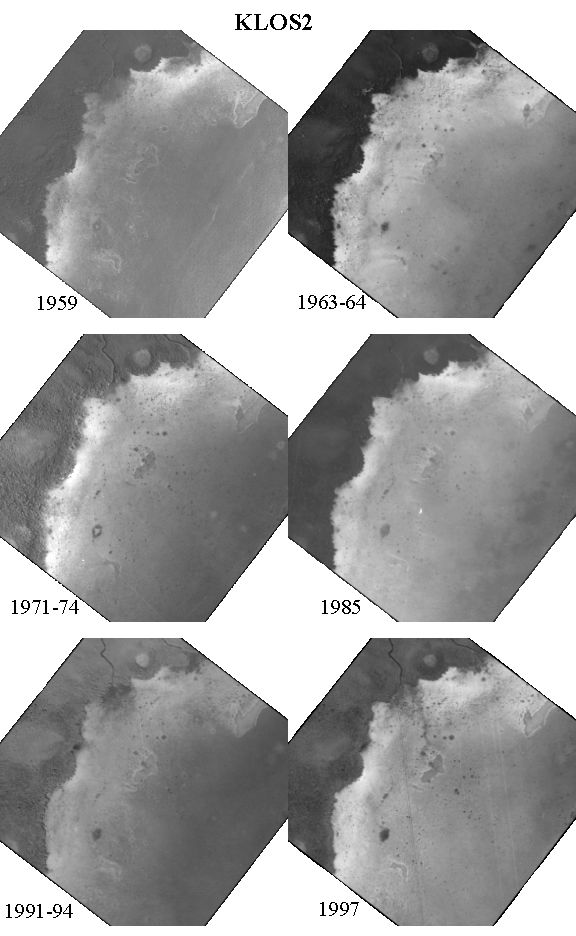
| 1959 | 1963-64 | 1971-74 | 1985 | 1991-94 | 1997 | |||||||
| Net Change | Variability | Net Change | Variability | Net Change | Variability | Net Change | Variability | Net Change | Variability | Net Change | Variability | |
| BH1 | 0.00 | 0.00 | -6.00 | 0.41 | -3.00 | 0.48 | -8.00 | 0.83 | 1.00 | 0.18 | 7.00 | 0.50 |
| BH2 | 0.00 | 0.00 | 4.00 | 0.35 | 3.00 | 0.31 | 9.00 | 0.60 | 0.00 | 0.26 | 1.00 | 0.32 |
| BS1 | 0.00 | 0.00 | 3.00 | 0.31 | 0.00 | 0.00 | 5.00 | 0.59 | 12.00 | 0.56 | 4.00 | 0.57 |
| BS2 | 0.00 | 0.00 | -7.00 | 0.43 | 1.00 | 0.32 | 0.00 | 0.26 | -1.00 | 0.32 | 3.00 | 0.31 |
| OH1 | 0.00 | 0.00 | 0.00 | 0.00 | 1.00 | 0.41 | -1.00 | 0.32 | 2.00 | 0.45 | 1.00 | 0.56 |
| OH2 | 0.00 | 0.00 | -3.00 | 0.31 | 14.00 | 0.51 | 1.00 | 0.41 | 6.00 | 0.55 | 1.00 | 0.56 |
| OS1 | 0.00 | 0.00 | -3.00 | 0.40 | 2.00 | 0.37 | -2.00 | 0.37 | 0.00 | 0.37 | -5.00 | 0.38 |
| OS2 | 0.00 | 0.00 | -21.00 | 0.47 | 7.00 | 0.50 | 1.00 | 0.18 | 9.00 | 0.47 | -3.00 | 0.31 |
| Mean | 0.00 | 0.00 | -4.13 | 0.33 | 3.13 | 0.36 | 0.63 | 0.44 | 3.63 | 0.40 | 1.13 | 0.44 |
| StDev | 0.00 | 0.00 | 7.36 | 0.14 | 4.88 | 0.16 | 4.66 | 0.20 | 4.50 | 0.13 | 3.55 | 0.11 |
(click on thumbnails to compare results from other study areas)
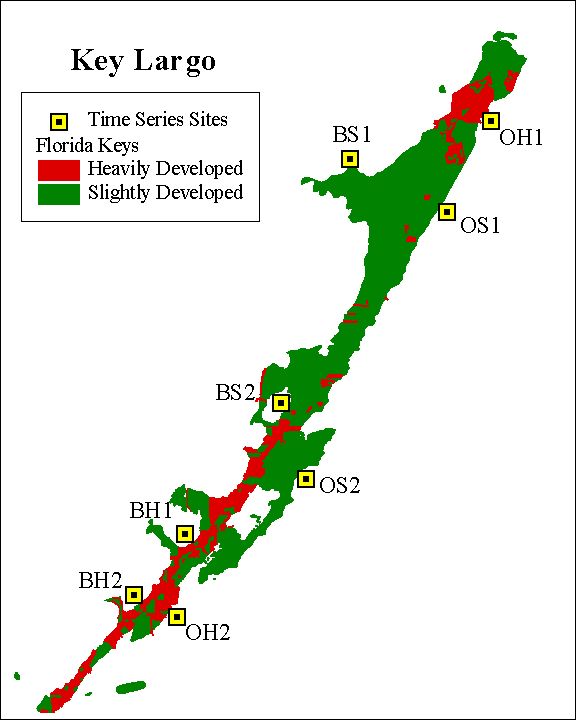
Spatial Variation in Nearshore Benthic Communities: Key Largo Study Area
Nutrient Regimes of Nearshore Benthic Communities: Key Largo Study Area
Relationships Between Project Data and Florida Keys Land Use: Key Largo Study Area