Key Largo Study Area

Spatial Variation in Nearshore Benthic Communities

Distribution of Taxa

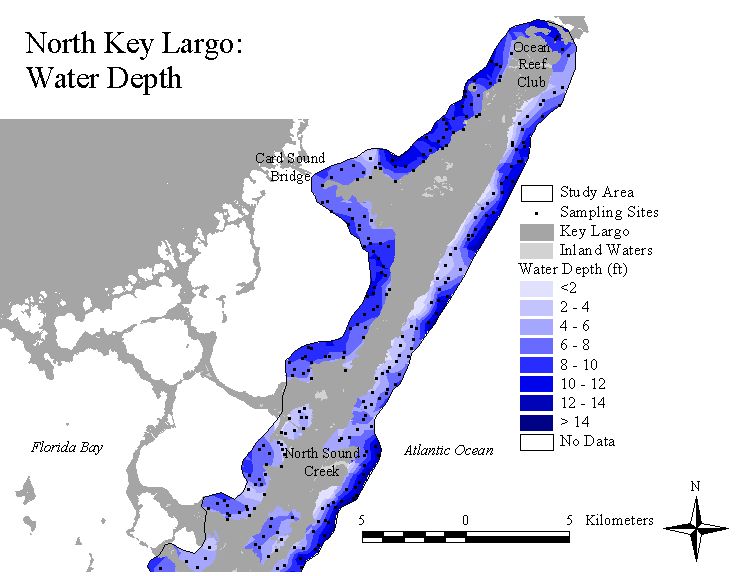
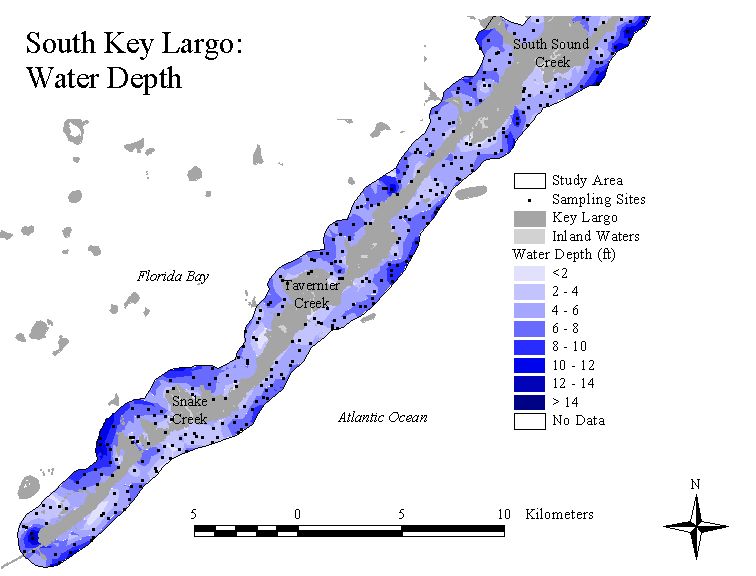
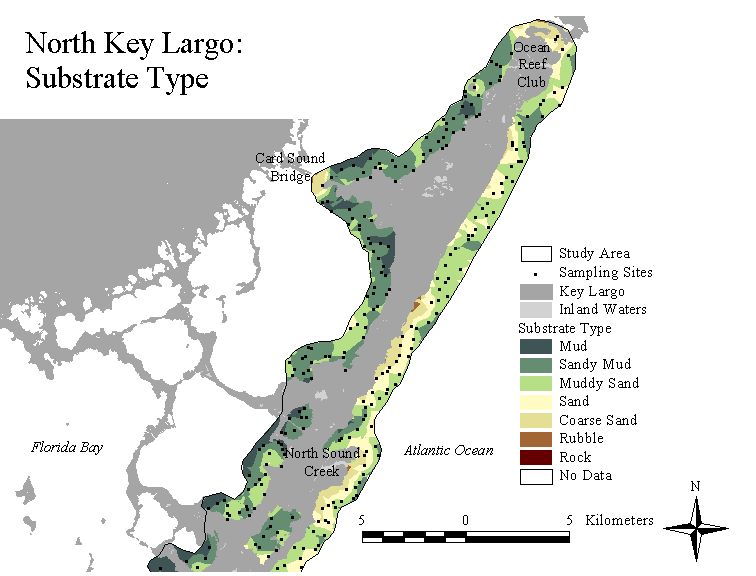
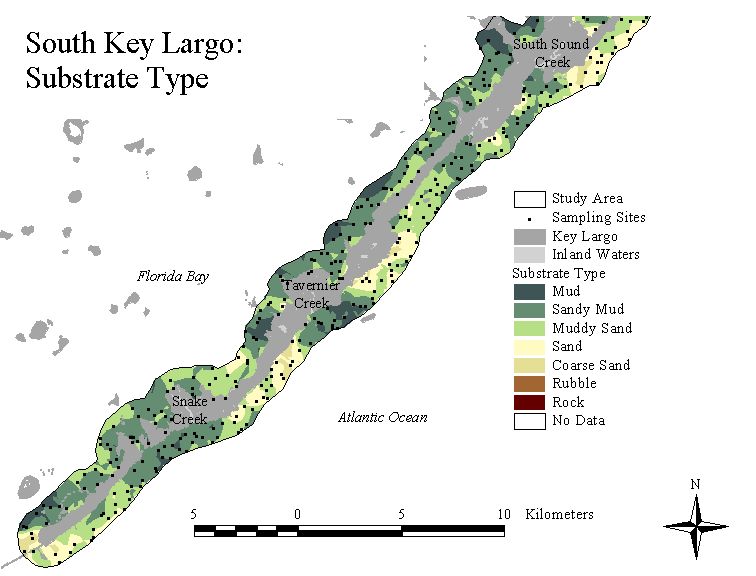
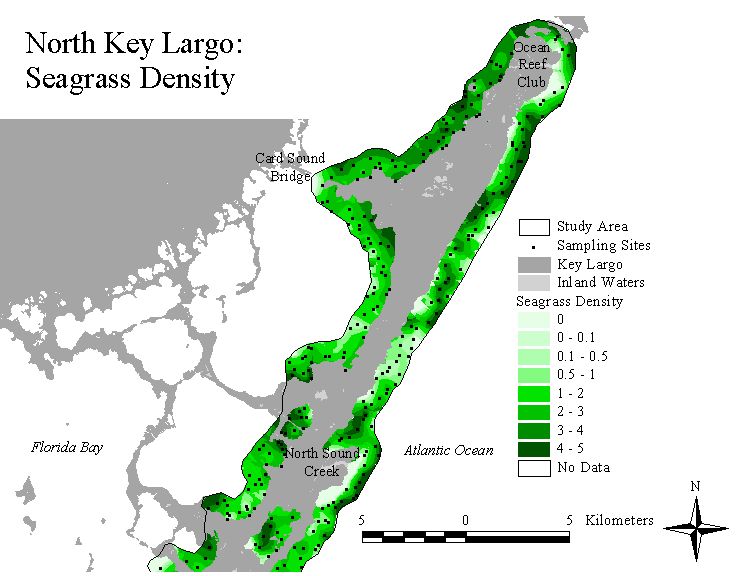
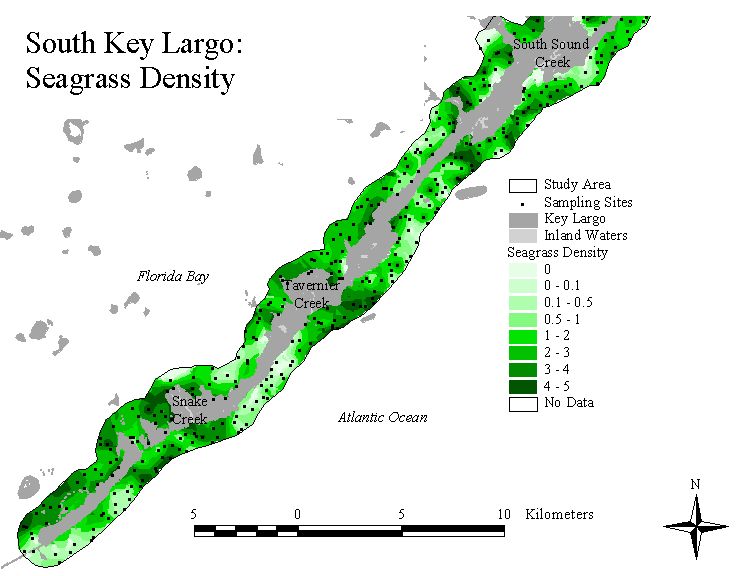
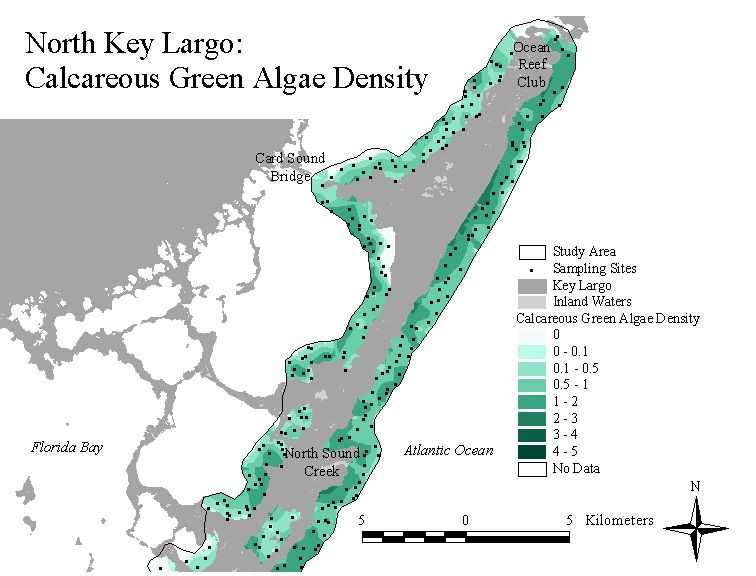
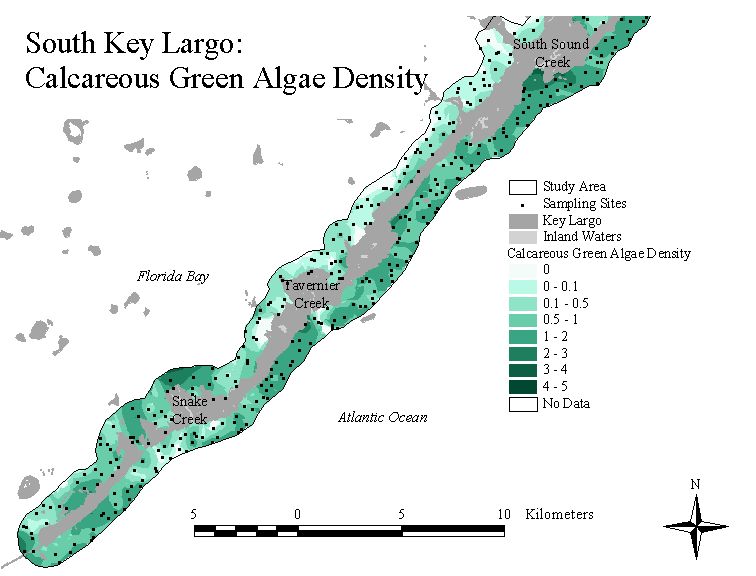
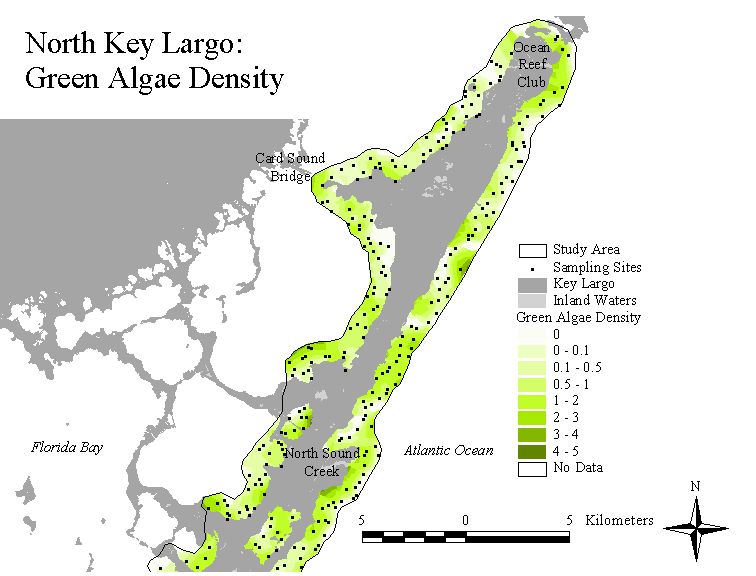
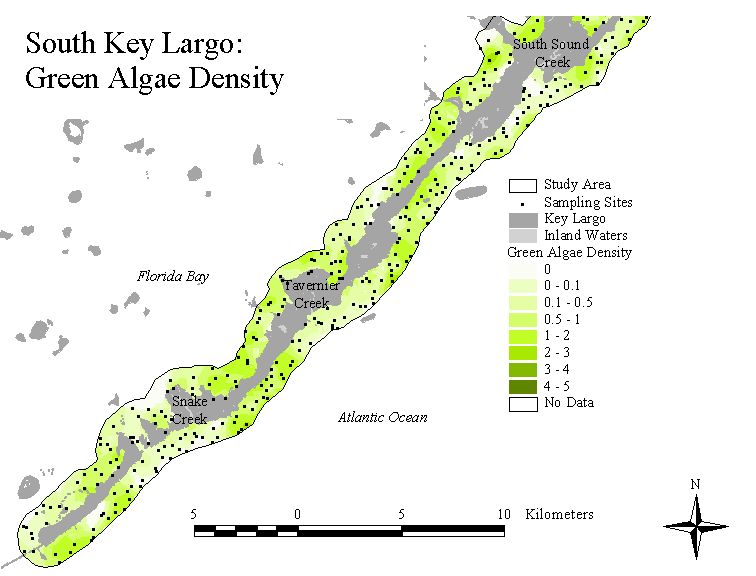
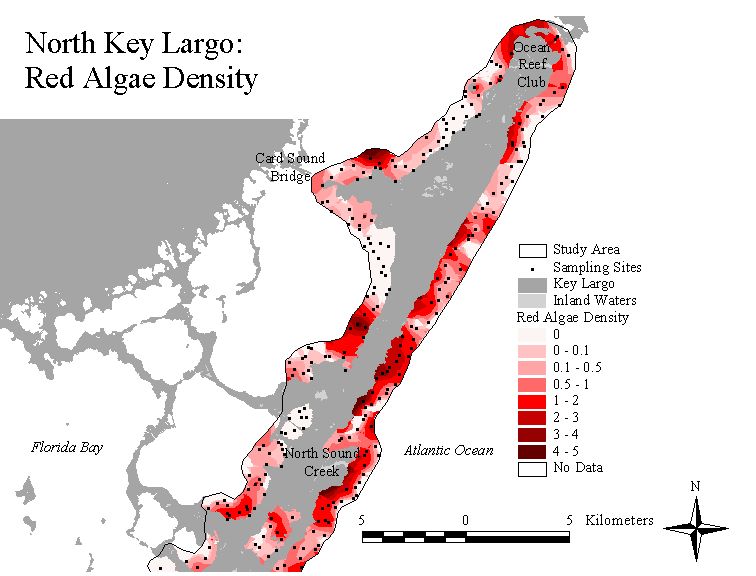
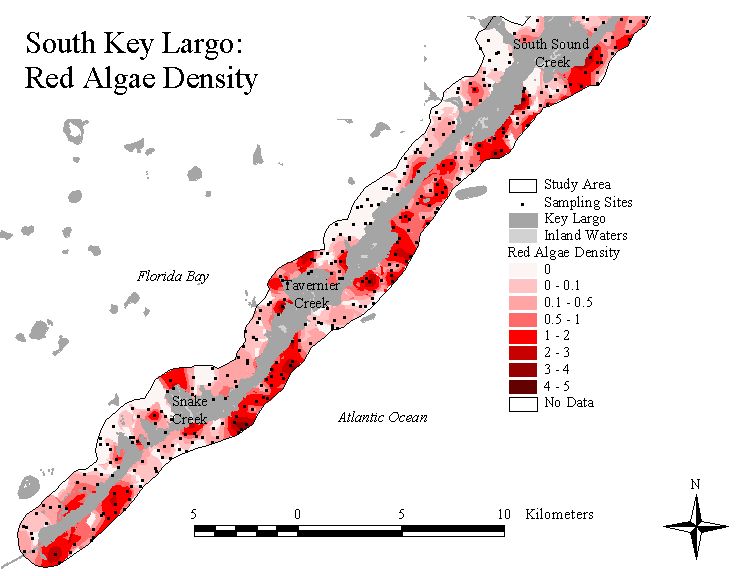
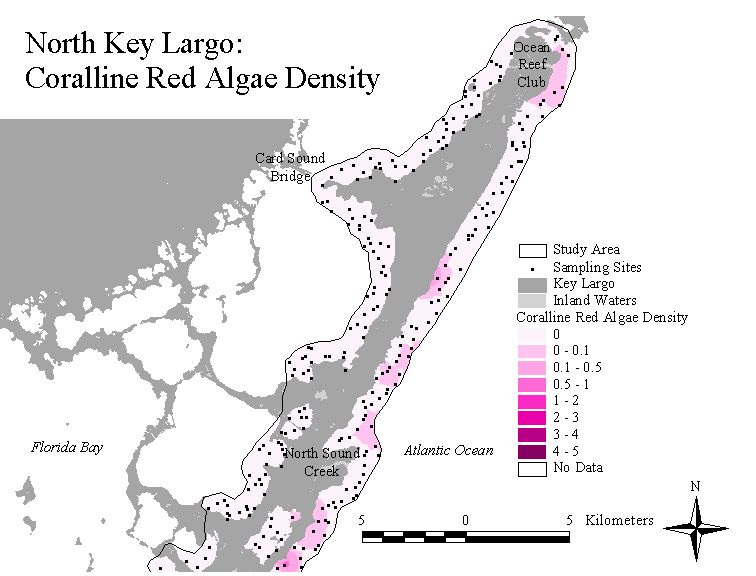
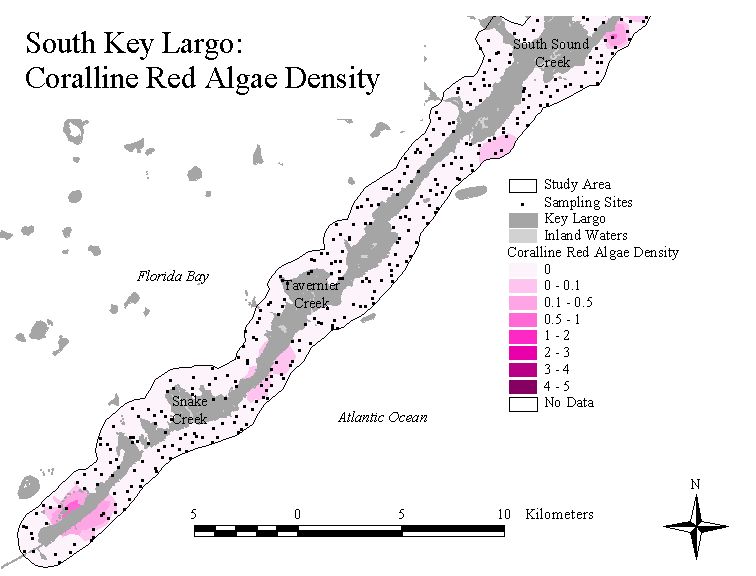
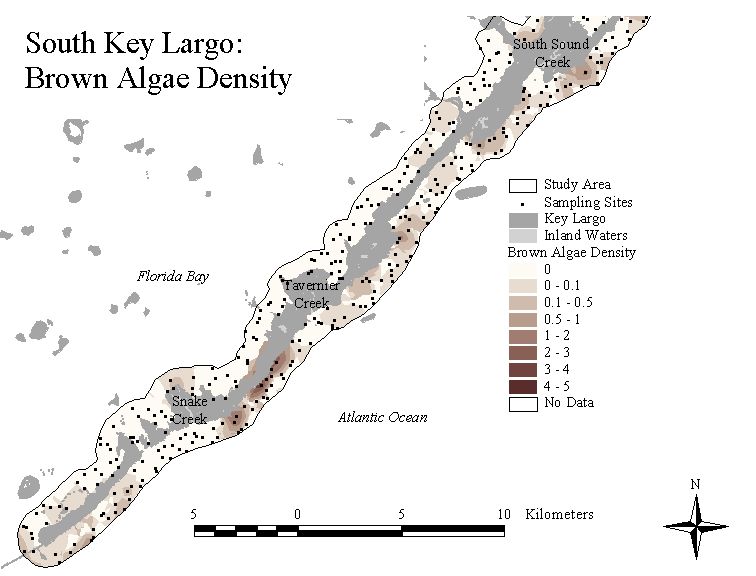
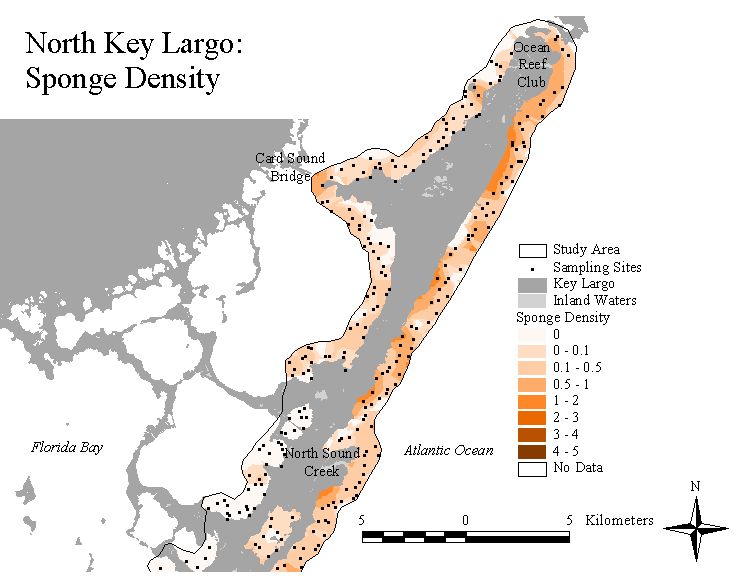
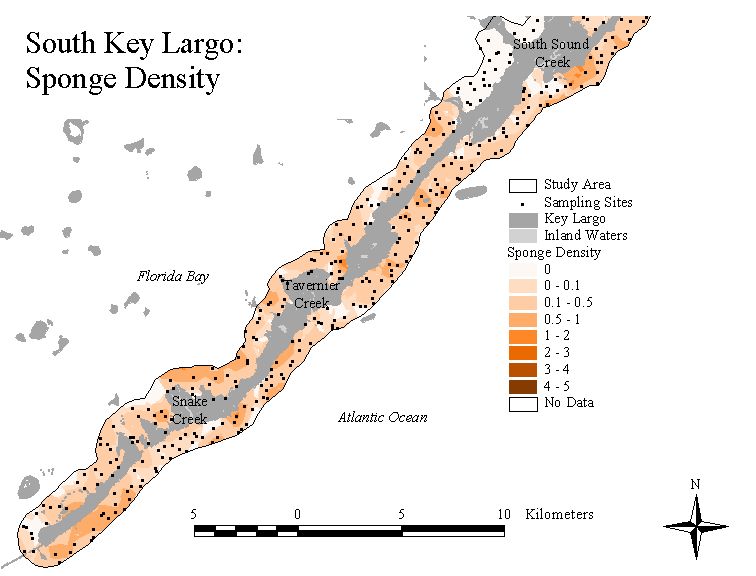
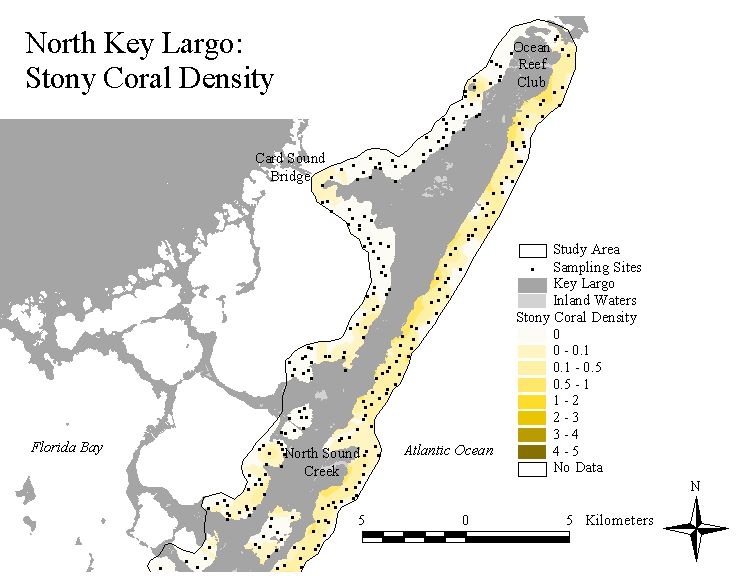
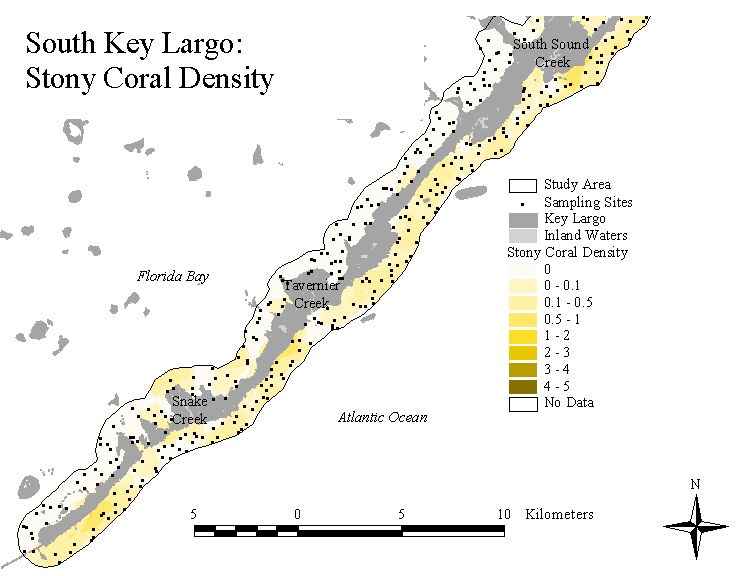
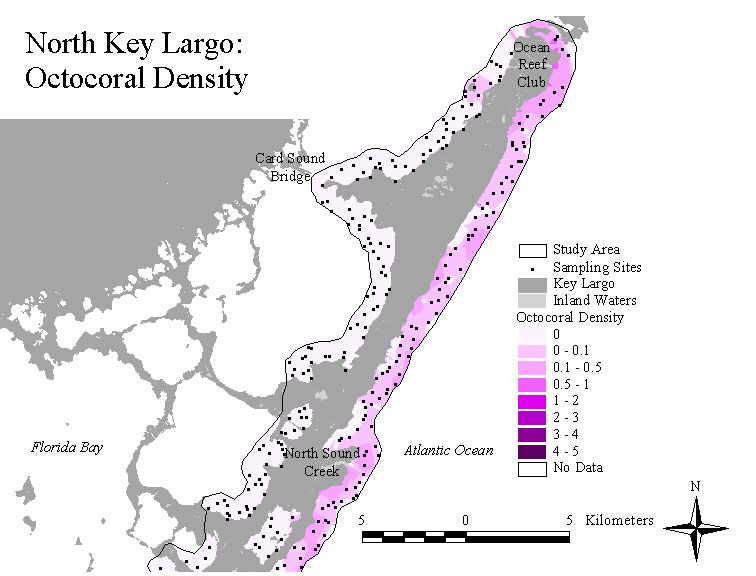
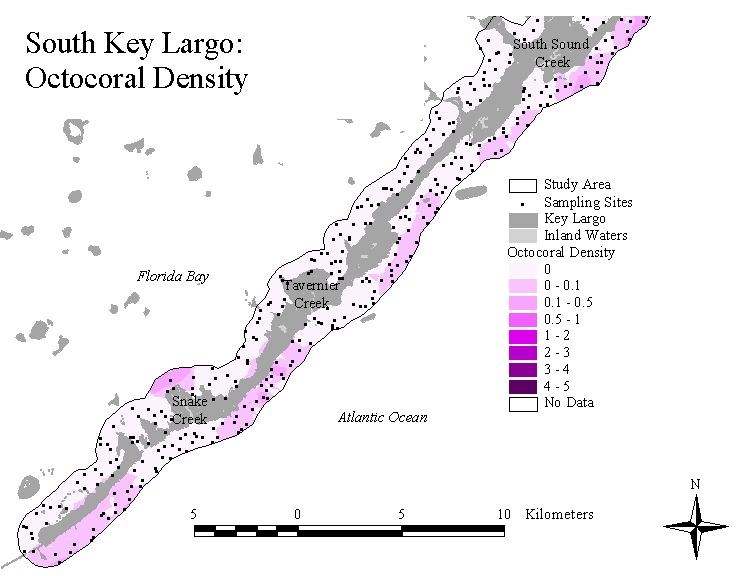
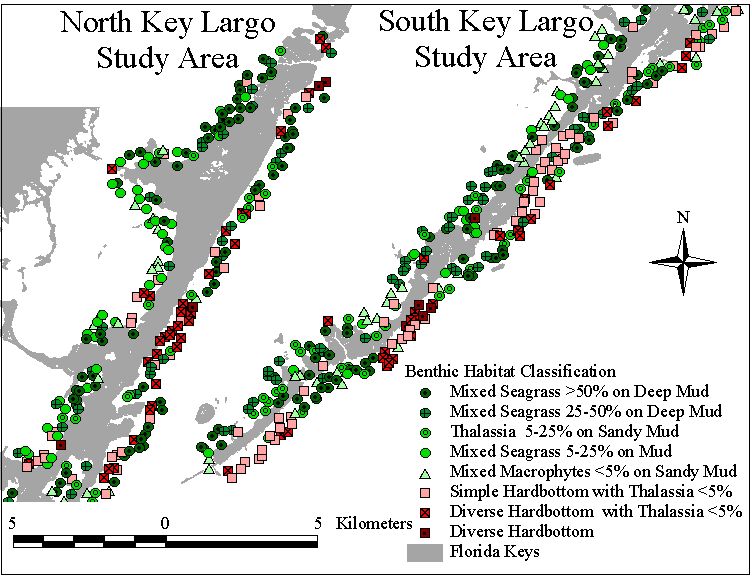
Nearshore benthic community composition was documented at approximately 1400 sampling locations throughout the Florida Keys study area.  A modified Braun Blanquet survey method was used to record the percent cover of 84 individual taxa and 9 taxa groups at each site.    These point data were used to calculate frequency, abundance, and density scores for each taxa and taxa group.   Interpolated surfaces for each taxa group were created using a universal kriging algorithm.  The interpolated surfaces below represent the approximate distribution of each taxa throughout the study area.


(click on thumbnails for enlarged maps)

klseagrassn.jpg (69830 bytes)klseagrasss.jpg (65067 bytes)klcalcgreenn.jpg (67764 bytes)klcalcgreens.jpg (63175 bytes)klgreenn.jpg (68238 bytes)klgreens.jpg (64077 bytes)klredn.jpg (68724 bytes)klreds.jpg (64998 bytes)klcoralredn.jpg (68289 bytes)klcoralreds.jpg (63960 bytes)klbrownn.jpg (66128 bytes)klbrowns.jpg (62240 bytes)klspongen.jpg (66405 bytes)klsponges.jpg (62529 bytes)klstonycoraln.jpg (67058 bytes)klstonycorals.jpg (63035 bytes)kloctocoraln.jpg (65980 bytes)kloctocorals.jpg (61821 bytes)


Physical Data Maps

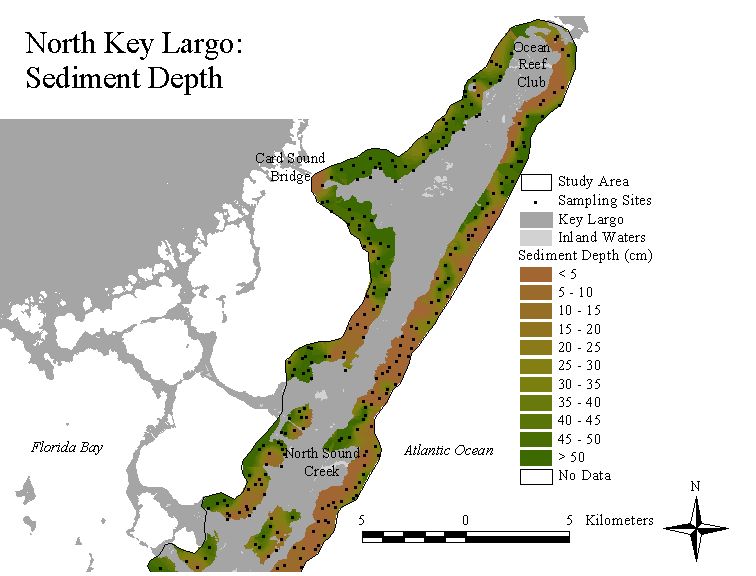
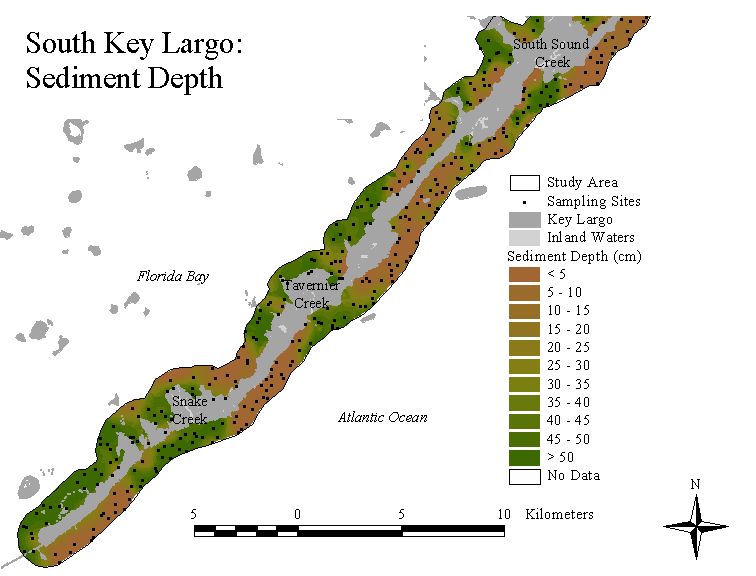
Physical data, such as water depth, substrate type, and sediment depth were also recorded at each site.  Interpolated surfaces for physical data were also created using a universal kriging algorithm. 

(click on thumbnails for enlarged maps)

klwaterdepthn.jpg (66587 bytes)klwaterdepths.jpg (62551 bytes)klsubtypen.jpg (66985 bytes)klsubtypes.jpg (63224 bytes)klseddepthn.jpg (67149 bytes)klseddepths.jpg (63792 bytes)


Community Classification


Temporal Variation in Nearshore Benthic Communities:  Key Largo Study Area

Nutrient Regimes of Nearshore Benthic Communities:  Key Largo Study Area

Relationships Between Project Data and Florida Keys Land Use:  Key Largo Study Area

Key Largo Study Area


Home        Report        Study Area        Data Locator