(Analysis of Covariance for Taxa Groups and Substrates)
Download Excel Spreadsheet: Key Largo General Linear Model Statistics- ANCOVA for Individual Taxa
(Analysis of Covariance for Individual Taxa)
(Spearman Partial Correlation Coefficients for Taxa Groups and Substrates)
Download Excel Spreadsheet: Key Largo Radial Model Statistics- Spearman for Individual Taxa
(Spearman Partial Correlation Coefficients for Individual Taxa)

| Key Largo | ||
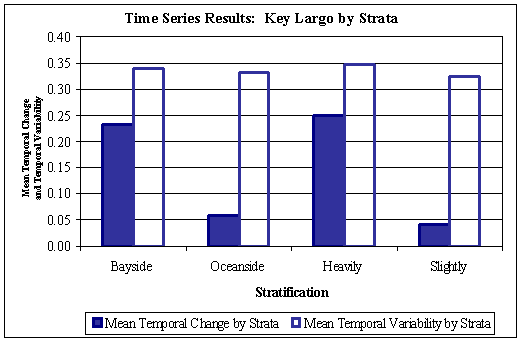
| Change | Variability | |
| Bayside | 0.23 | 0.34 |
| Oceanside | 0.06 | 0.33 |
| Heavily | 0.25 | 0.35 |
| Slightly | 0.04 | 0.32 |
| Bayside StDev | 0.53 | 0.12 |
| Oceanside StDev | 0.42 | 0.13 |
| Heavily StDev | 0.44 | 0.10 |
| Slightly StDev | 0.51 | 0.14 |
(click on thumbnails to compare results from other study areas)
(Analysis of Covariance for for Nutrient Parameters)
Download Excel Spreadsheet: Key Largo Radial Model Statistics- Spearman for Nutrient Parameters
(Spearman Partial Correlation Coefficients for Nutrient Parameters)
Spatial Variation in Nearshore Benthic Communities: Key Largo Study Area
Temporal Variation in Nearshore Benthic Communities: Key Largo Study Area
Nutrient Regimes of Nearshore Benthic Communities: Key Largo Study Area
Home Report Study Area Data Locator