| Site Name | Area | Strata | 1997 | 1994 | 1985 | 1974 | 1964 | 1959 |
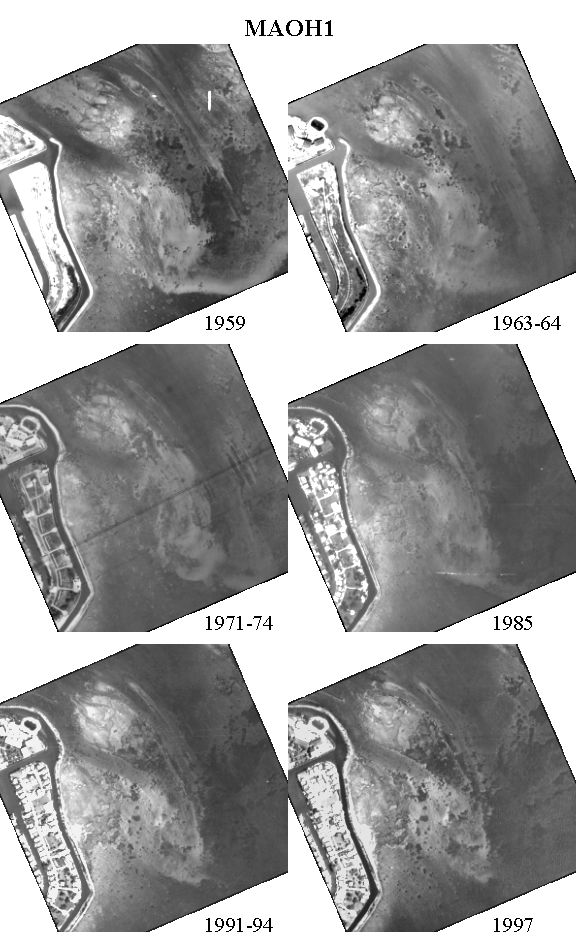
| Duck Key | MA | OH1 | PD-4488-11-04 | PD-4221-11-04 | PD-3117-10-10 | PD-913-07-12 | PD-230-08-12 | PD-88-09-14 |
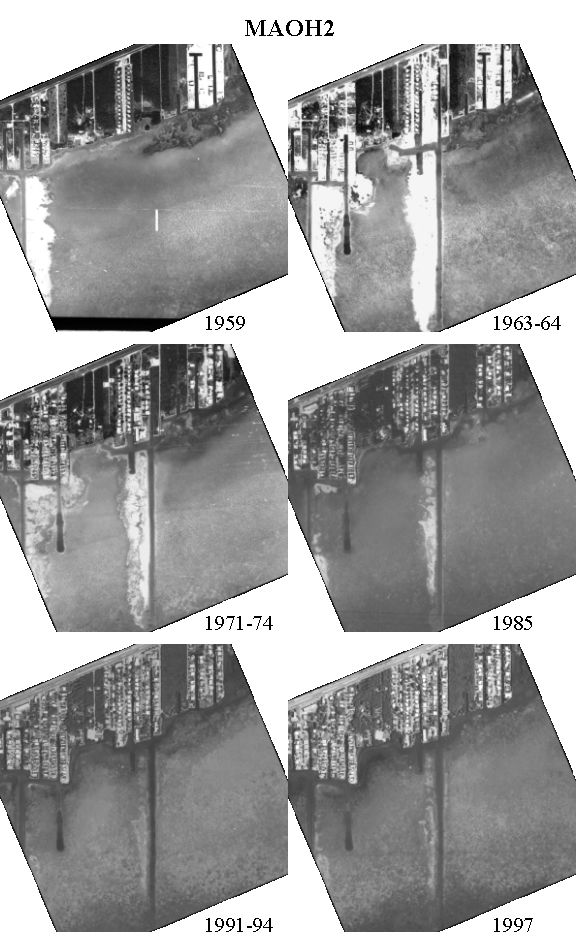
| Airstrip | MA | OH2 | PD-4488-09-07 | PD-4221-09-06 | PD-3117-09-06 | PD-913-05-30 | PD-230-08-05 | PD-88-07-47 |
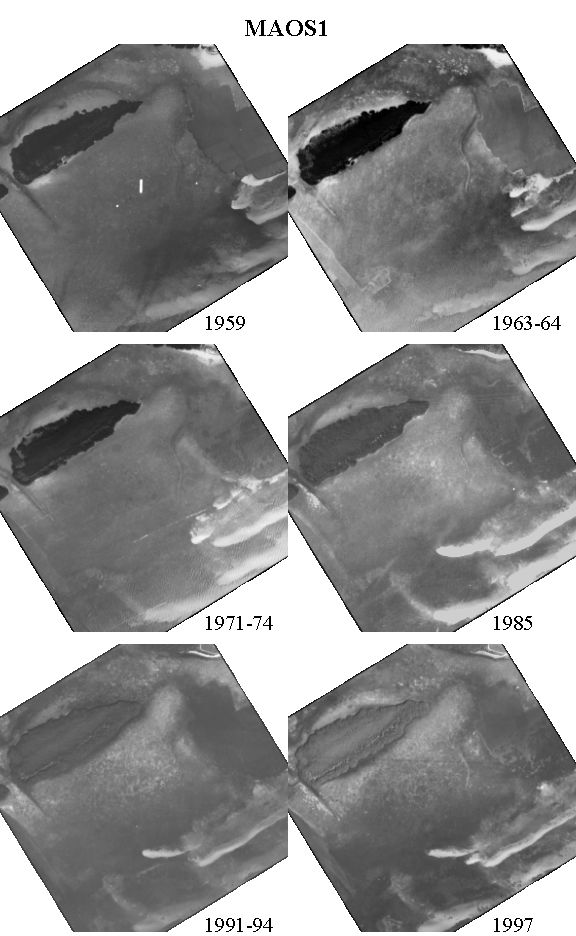
| Valhalla | MA | OS1 | PD-4488-10-05 | PD-4221-10-04 | PD-3117-10-06 | PD-913-07-09 | PD-230-07-27 | PD-88-08-15 |
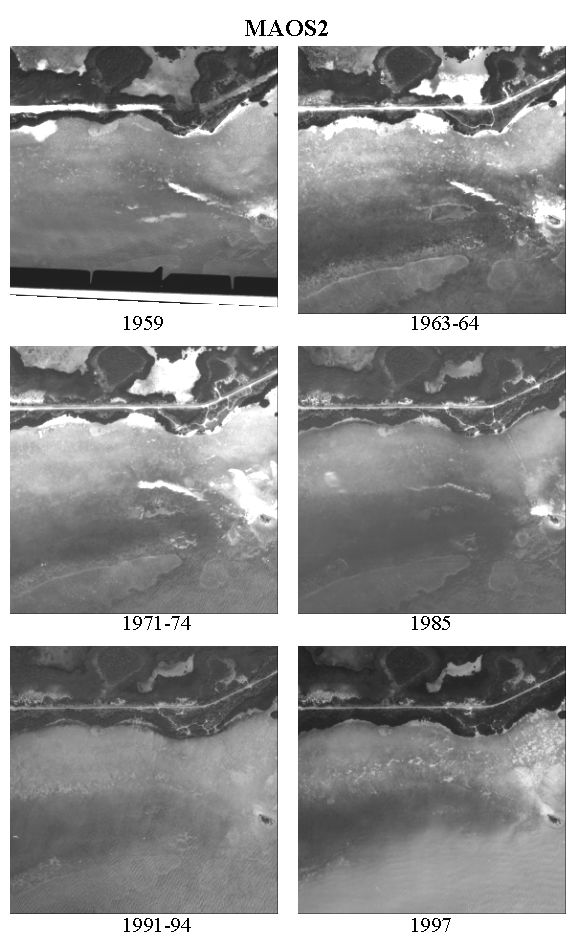
| Boot Key | MA | OS2 | PD-4488-06-14 | PD-4221-06-25 | PD-3117-06-20 | PD-913-05-29 | PD-230-08-02 | PD-88-07-43 |
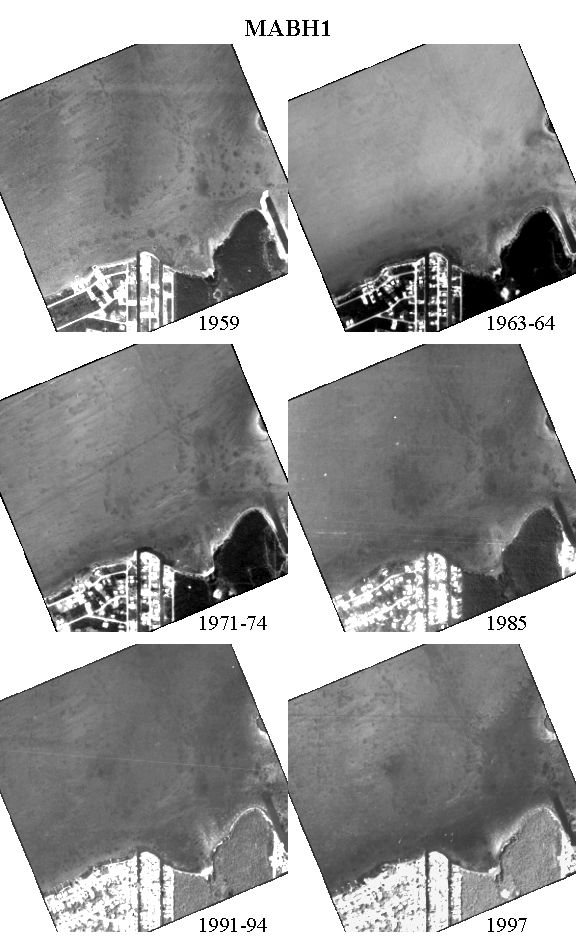
| Stirrup Key | MA | BH1 | PD-4488-10-02 | PD-4221-09-05 | PD-3117-09-07 | PD-913-07-06 | PD-230-09-11 | PD-88-08-10 |
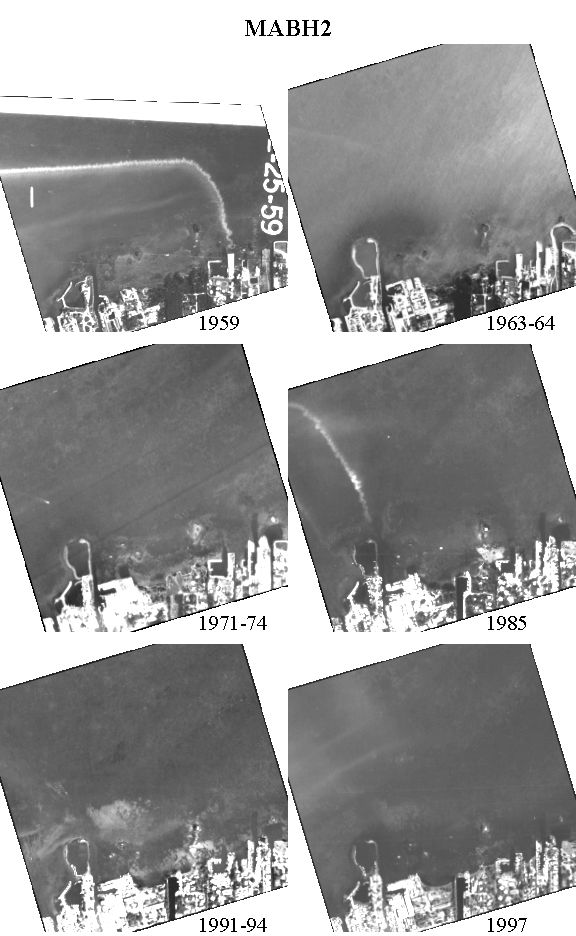
| Faro Blanco | MA | BH2 | PD-4488-09-05 | PD-4221-09-03 | PD-3117-09-04 | PD-913-07-02 | PD-230-09-09 | PD-88-07-42 |
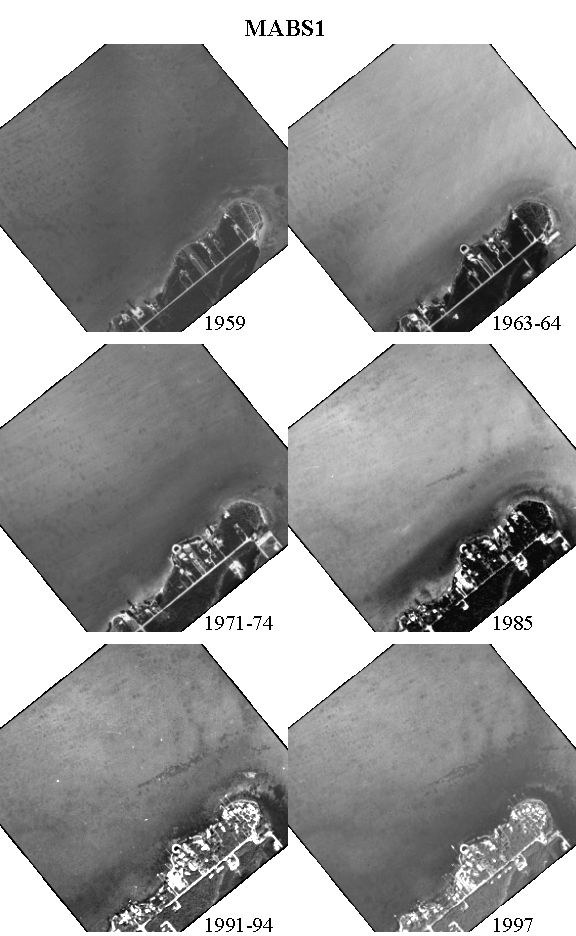
| Grassy Key | MA | BS1 | PD-4488-11-02 | PD-4221-11-02 | PD-3117-11-03 | PD-913-07-10 | PD-230-09-16 | PD-88-09-09 |
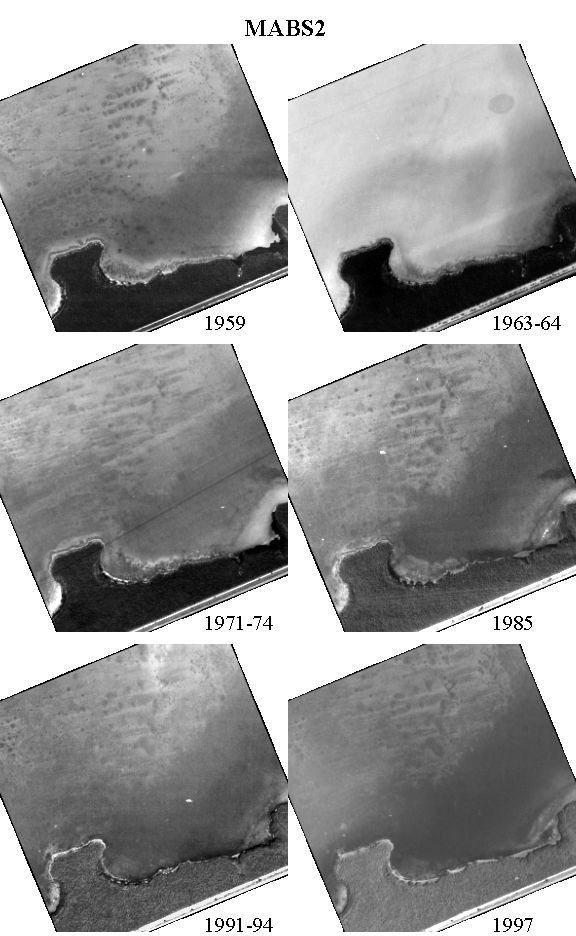
| Long Point | MA | BS2 | PD-4488-10-04 | PD-4221-10-03 | PD-3117-10-04 | PD-913-07-08 | PD-230-07-26 | PD-88-08-13 |
(click on thumbnails for enlarged photos)
| BH1 | BH2 | BS1 | BS2 | OH1 | OH2 | OS1 | OS2 | |||||||||
| Net Change | Variability | Net Change | Variability | Net Change | Variability | Net Change | Variability | Net Change | Variability | Net Change | Variability | Net Change | Variability | Net Change | Variability | |
| Mean | 0.13 | 0.40 | 0.37 | 0.33 | 0.00 | 0.12 | 0.43 | 0.22 | 0.37 | 0.17 | 0.37 | 0.45 | 0.07 | 0.30 | 0.00 | 0.19 |
| StDev | 0.78 | 0.30 | 0.67 | 0.27 | 0.45 | 0.21 | 0.68 | 0.21 | 0.56 | 0.24 | 1.27 | 0.55 | 0.91 | 0.32 | 0.45 | 0.26 |
(click on thumbnails to compare results from other study areas)
| 1959 | 1963-64 | 1971-74 | 1985 | 1991-94 | 1997 | |||||||
| Net Change | Variability | Net Change | Variability | Net Change | Variability | Net Change | Variability | Net Change | Variability | Net Change | Variability | |
| BH1 | 0.00 | 0.00 | 0.00 | 0.26 | -4.00 | 0.51 | 8.00 | 0.52 | 2.00 | 0.58 | -2.00 | 0.58 |
| BH2 | 0.00 | 0.00 | -1.00 | 0.18 | 2.00 | 0.37 | 4.00 | 0.57 | 0.00 | 0.53 | 6.00 | 0.41 |
| BS1 | 0.00 | 0.00 | 0.00 | 0.00 | -1.00 | 0.18 | -2.00 | 0.45 | 1.00 | 0.18 | 2.00 | 0.25 |
| BS2 | 0.00 | 0.00 | 0.00 | 0.00 | 1.00 | 0.18 | 3.00 | 0.31 | 5.00 | 0.38 | 4.00 | 0.51 |
| OH1 | 0.00 | 0.00 | 2.00 | 0.37 | 3.00 | 0.31 | 3.00 | 0.40 | 2.00 | 0.25 | 1.00 | 0.18 |
| OH2 | 0.00 | 0.00 | 2.00 | 1.23 | 10.00 | 0.66 | 1.00 | 0.49 | -5.00 | 0.46 | 3.00 | 0.55 |
| OS1 | 0.00 | 0.00 | -3.00 | 0.48 | 2.00 | 0.58 | 4.00 | 0.35 | 3.00 | 0.40 | -4.00 | 0.43 |
| OS2 | 0.00 | 0.00 | -4.00 | 0.35 | 1.00 | 0.32 | 4.00 | 0.35 | 0.00 | 0.00 | -1.00 | 0.41 |
| Mean | 0.00 | 0.00 | -0.50 | 0.36 | 1.75 | 0.39 | 3.13 | 0.43 | 1.00 | 0.35 | 1.13 | 0.42 |
| StDev | 0.00 | 0.00 | 2.00 | 0.37 | 3.73 | 0.17 | 2.67 | 0.09 | 2.74 | 0.18 | 3.10 | 0.13 |
(click on thumbnails to compare results from other study areas)
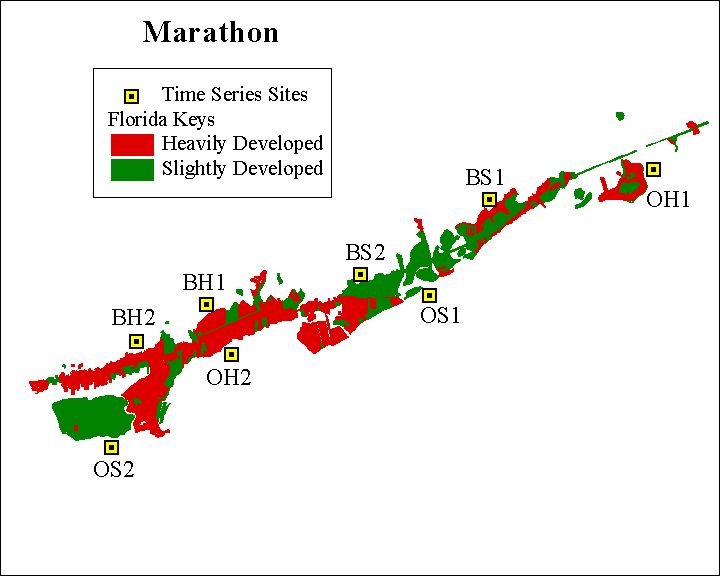
Spatial Variation in Nearshore Benthic Communities: Marathon Study Area
Nutrient Regimes of Nearshore Benthic Communities: Marathon Study Area
Relationships Between Project Data and Florida Keys Land Use: Marathon Study Area
Home Report Study Area Data Locator