(Analysis of Covariance for Taxa Groups and Substrates)
Download Excel Spreadsheet: Marathon General Linear Model Statistics- ANCOVA for Individual Taxa
(Analysis of Covariance for Individual Taxa)
(Spearman Partial Correlation Coefficients for Taxa Groups and Substrates)
Download Excel Spreadsheet: Marathon Radial Model Statistics- Spearman for Individual Taxa
(Spearman Partial Correlation Coefficients for Individual Taxa)

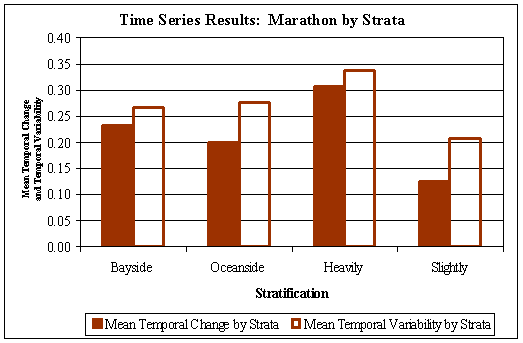
| Marathon | ||
| Change | Variability | |
| Bayside | 0.23 | 0.27 |
| Oceanside | 0.20 | 0.28 |
| Heavily | 0.31 | 0.34 |
| Slightly | 0.13 | 0.21 |
| Bayside StDev | 0.20 | 0.12 |
| Oceanside StDev | 0.19 | 0.13 |
| Heavily StDev | 0.12 | 0.12 |
| Slightly StDev | 0.21 | 0.07 |
(click on thumbnails to compare results from other study areas)
Download Excel Spreadsheet: Marathon General Linear Model Statistics- ANCOVA for Nutrient Parameters
(Analysis of Covariance for Nutrient Parameters)
Download Excel Spreadsheet: Marathon Radial Model Statistics- Spearman for Nutrient Parameters
(Spearman Partial Correlation Coefficients for Nutrient Parameters)
Spatial Variation in Nearshore Benthic Communities: Marathon Study Area
Temporal Variation in Nearshore Benthic Communities: Marathon Study Area
Nutrient Regimes of Nearshore Benthic Communities: Marathon Study Area
Home Report Study Area Data Locator