| Site Name | Area | Strata | 1997 | 1994 | 1985 | 1974 | 1964 | 1959 |
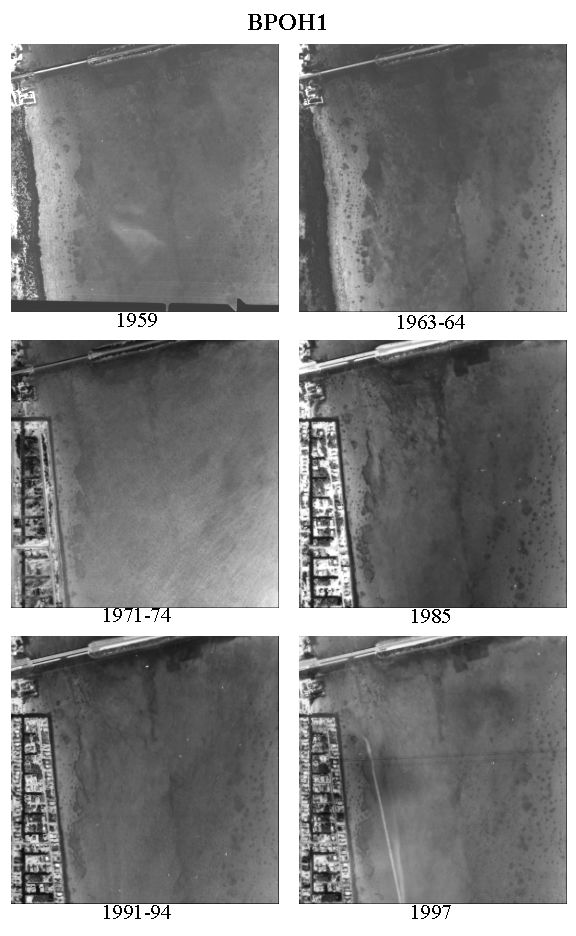
| Little Torch | BP | OH1 | PD-4488-05-15 | PD-4221-05-16 | PD-3117-05-15 | PD-913-04-19 | PD-230-01-23 | PD-88-06-24 |
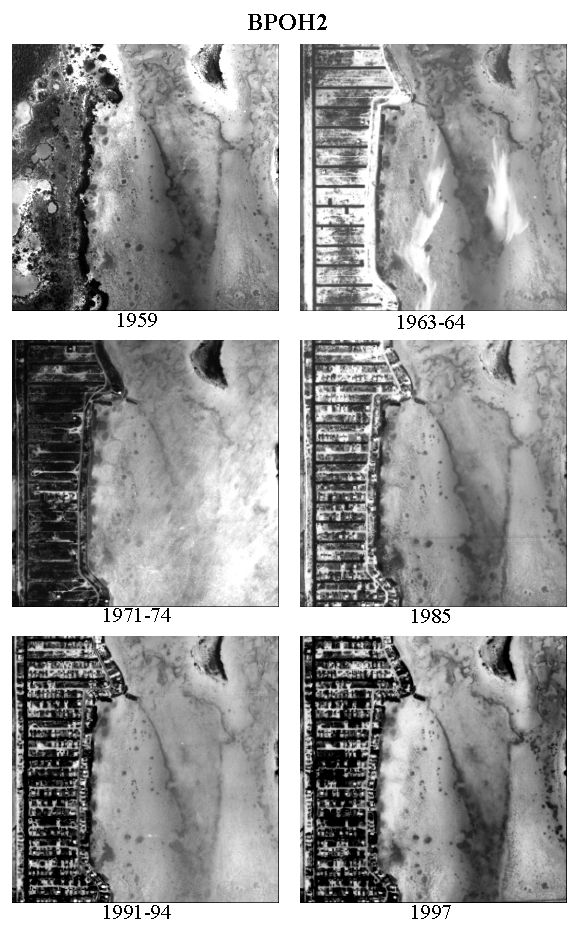
| Ramrod Key | BP | OH2 | PD-4488-05-16 | PD-4221-05-15 | PD-3117-05-14 | PD-913-04-18 | PD-230-01-22 | PD-88-05-28 |
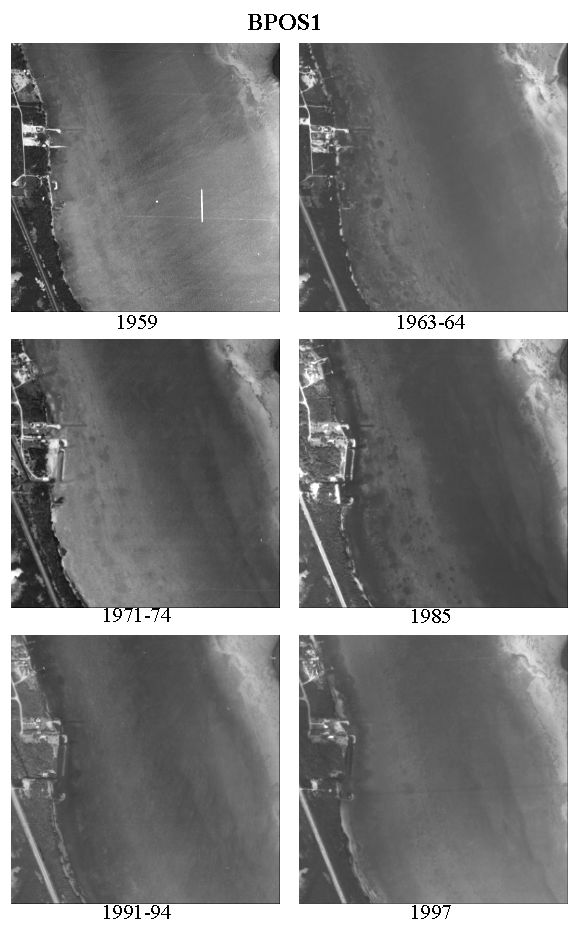
| Spanish Harbor | BP | OS1 | PD-4488-05-19 | PD-4221-05-19 | PD-3117-05-18 | PD-913-04-21 | PD-230-01-25 | PD-88-05-36 |
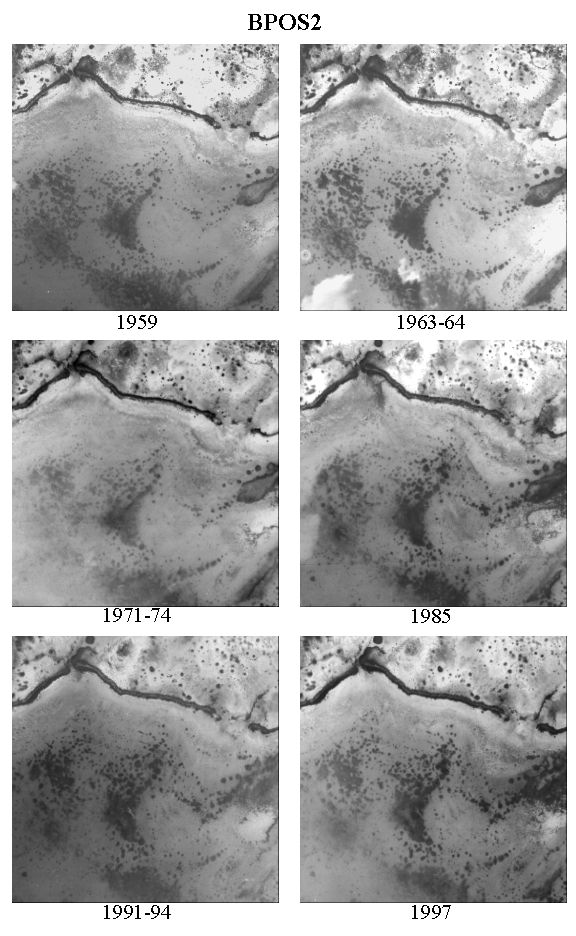
| Newfound Harbor | BP | OS2 | PD-4488-05-17 | PD-4221-05-18 | PD-3117-05-16 | PD-913-04-20 | PD-230-01-24 | PD-88-05-33 |
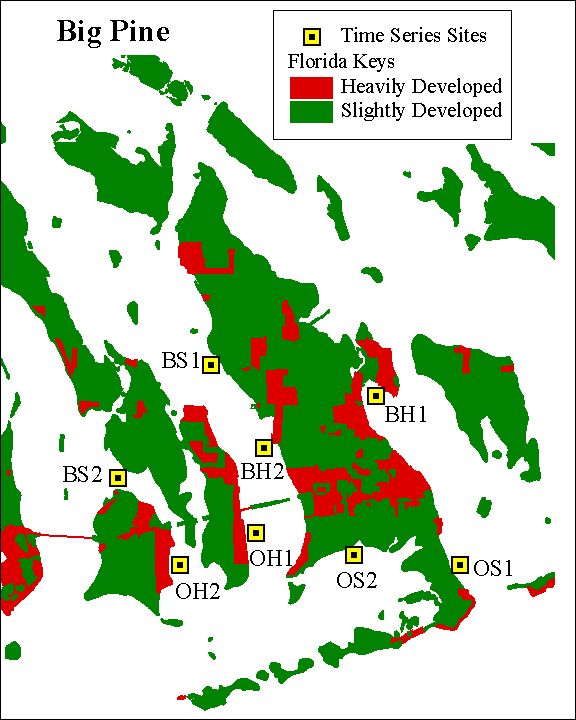
| Doctor's Arm | BP | BH1 | PD-4488-06-03 | PD-4221-06-13 | PD-3117-06-05 | PD-913-05-16 | PD-230-02-24 | PD-88-06-28 |
| Big Pine South | BP | BH2 | PD-4488-06-02 | PD-4221-06-11 | PD-3117-06-03 | PD-913-04-20 | PD-230-02-22 | PD-88-06-23 |
| Big Pine North | BP | BS1 | PD-4488-06-01 | PD-4221-06-10 | PD-3117-06-02 | PD-913-05-14 | PD-230-03-22 | PD-88-07-20 |
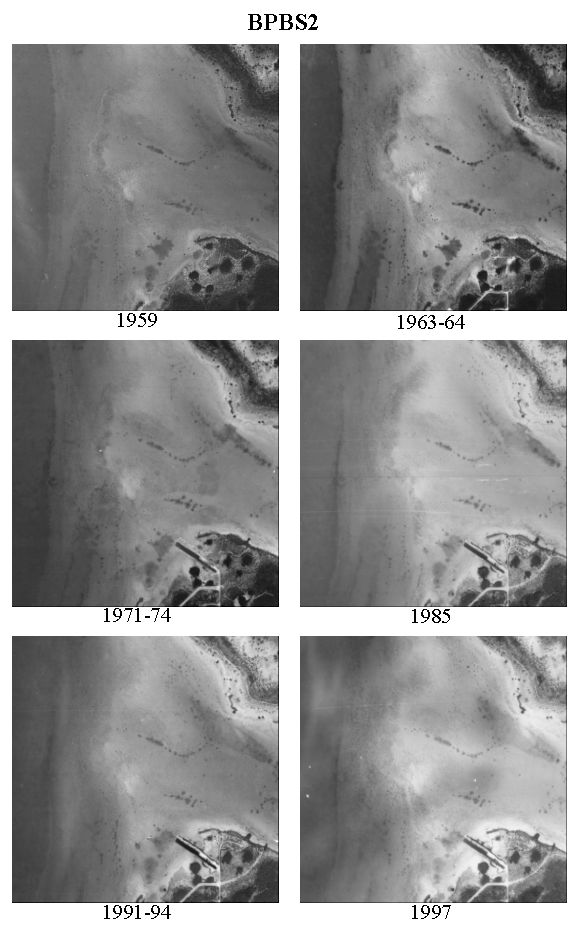
| Middle Torch | BP | BS2 | PD-4488-05-15 | PD-4221-05-14 | PD-3117-05-13 | PD-913-04-17 | PD-230-02-21 | PD-88-06-21 |
(click on thumbnails for enlarged photos)
| BH1 | BH2 | BS1 | BS2 | OH1 | OH2 | OS1 | OS2 | |||||||||
| Net Change | Variability | Net Change | Variability | Net Change | Variability | Net Change | Variability | Net Change | Variability | Net Change | Variability | Net Change | Variability | Net Change | Variability | |
| Mean | 0.07 | 0.19 | -0.07 | 0.05 | -0.20 | 0.10 | 0.00 | 0.00 | -0.03 | 0.08 | -0.03 | 0.01 | 0.07 | 0.10 | 0.00 | 0.05 |
| StDev | 0.58 | 0.25 | 0.25 | 0.15 | 0.41 | 0.19 | 0.00 | 0.00 | 0.32 | 0.19 | 0.18 | 0.07 | 0.37 | 0.20 | 0.37 | 0.14 |
(click on thumbnails to compare results from other study areas)
| 1959 | 1963-64 | 1971-74 | 1985 | 1991-94 | 1997 | |||||||
| Net Change | Variability | Net Change | Variability | Net Change | Variability | Net Change | Variability | Net Change | Variability | Net Change | Variability | |
| BH1 | 0.00 | 0.00 | 0.00 | 0.00 | -1.00 | 0.18 | 1.00 | 0.49 | 0.00 | 0.45 | 2.00 | 0.25 |
| BH2 | 0.00 | 0.00 | 1.00 | 0.18 | -3.00 | 0.31 | 0.00 | 0.00 | 0.00 | 0.00 | 0.00 | 0.00 |
| BS1 | 0.00 | 0.00 | 0.00 | 0.00 | -2.00 | 0.25 | -2.00 | 0.37 | -2.00 | 0.25 | 0.00 | 0.00 |
| BS2 | 0.00 | 0.00 | 0.00 | 0.00 | 0.00 | 0.00 | 0.00 | 0.00 | 0.00 | 0.00 | 0.00 | 0.00 |
| OH1 | 0.00 | 0.00 | 0.00 | 0.00 | 1.00 | 0.32 | 0.00 | 0.00 | -1.00 | 0.32 | -1.00 | 0.18 |
| OH2 | 0.00 | 0.00 | 0.00 | 0.00 | 0.00 | 0.00 | -1.00 | 0.18 | 0.00 | 0.00 | 0.00 | 0.00 |
| OS1 | 0.00 | 0.00 | 0.00 | 0.00 | 0.00 | 0.00 | 3.00 | 0.31 | 2.00 | 0.25 | -3.00 | 0.31 |
| OS2 | 0.00 | 0.00 | 0.00 | 0.00 | 0.00 | 0.26 | 0.00 | 0.00 | 1.00 | 0.18 | -1.00 | 0.18 |
| Mean | 0.00 | 0.00 | 0.13 | 0.02 | -0.63 | 0.17 | 0.13 | 0.17 | 0.00 | 0.18 | -0.38 | 0.12 |
| StDev | 0.00 | 0.00 | 0.33 | 0.06 | 1.22 | 0.13 | 1.36 | 0.19 | 1.12 | 0.16 | 1.32 | 0.12 |
(click on thumbnails to compare results from other study areas)
Spatial Variation in Nearshore Benthic Communities: Big Pine Study Area
Nutrient Regimes of Nearshore Benthic Communities: Big Pine Study Area
Relationships Between Project Data and Florida Keys Land Use: Big Pine Study Area
Home Report Study Area Data Locator